The S&P/TSX Capped Energy Index led the Canadian equity market, yielding a return of 79% to close 2021.
In 2021, the S&P/TSX Composite Index returned 21% while the Small Cap Index posted 18%. However, the heavyweights led with the TSX 60 putting up 24% on the board. Despite the sector’s 5 year compounded annual growth rate of -4%, the S&P/TSX Capped Energy Index closed 2021 with 79%, followed by S&P/TSX Capped Real Estate Index (33%), S&P/TSX Capped Financials Index (31%), and S&P/TSX Capped Consumer Staples (20.5%).
2022 started on shaky legs, but Canada’s equity indices remain upbeat. The indices remain above their respective 34 weekly exponential moving averages (EMA), providing confidence to remain in the game as opposed to substituting for the sidelines during heightened volatility at year-end.
Rising oil prices, ascending sector price action, expanding relative strength, and a bullish regime currently makes the energy sector an attractive space.
A carry-over theme from 2021 is rising rates and rising inflation. The 10-year US Treasury yield, currently at 1.77%, is observed rising. Sectors that benefit from rising rates include Financials, Industrials, and Consumer Discretionary. As the economy oscillates between growth and stagnation, central banks aim to balance interest rate revisions. A measured, steady rise in rates is a sign of a recovering economy, and the Energy sector is a beneficiary.
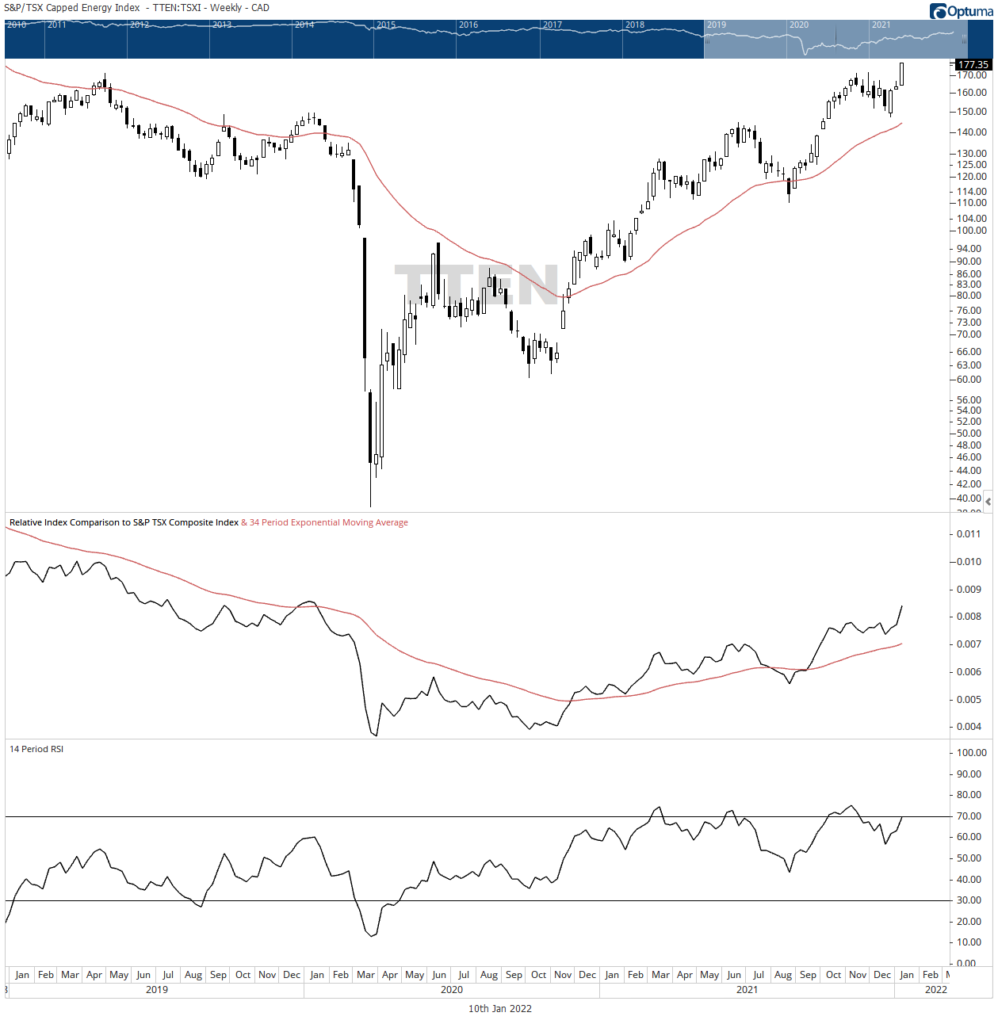
The S&P/TSX Capped Energy Index maintains an observable trend resembling an ascending stairway as constituents benefit from rising oil prices. At the time of writing, WTI was $78 (Canadian Crude Index was $65 and Western Canadian Select was $66). Since 2020’s historical negative oil, oil and gas production companies have spearheaded the sector’s rally, and are seemingly carrying that momentum into 2022. Year to date, the sector is up 8.44%.
An inflection point in price occurred during Q4/2020 – price crossed above its 34 weekly EMA followed by a minor pullback in Q1/2021, testing investor appetite. Resumed demand absorbed 2020’s pre-COVID-19 and 2019’s overhead supply on the backs of optimism and buying pressure.
The path of least resistance is investing in trending sectors. Especially in economic sectors exhibiting market leadership. The ascending ratio slope of the ‘S&P/TSX Capped Energy Index and S&P/TSX Composite Index’ supports the sector’s leading role in broader market performance. Discernable patterns of ascending peaks and troughs in price action and relative strength highlight sector strength, below.
As market participants accumulated positions at resistance levels, the commonly used 14-period Relative Strength Index (RSI) became overbought, highlighting persisting demand. In strong uptrends, peaks and troughs are observed at the upper half of the RSI indicator. These developments highlight a bullish regime supporting ascending price action.
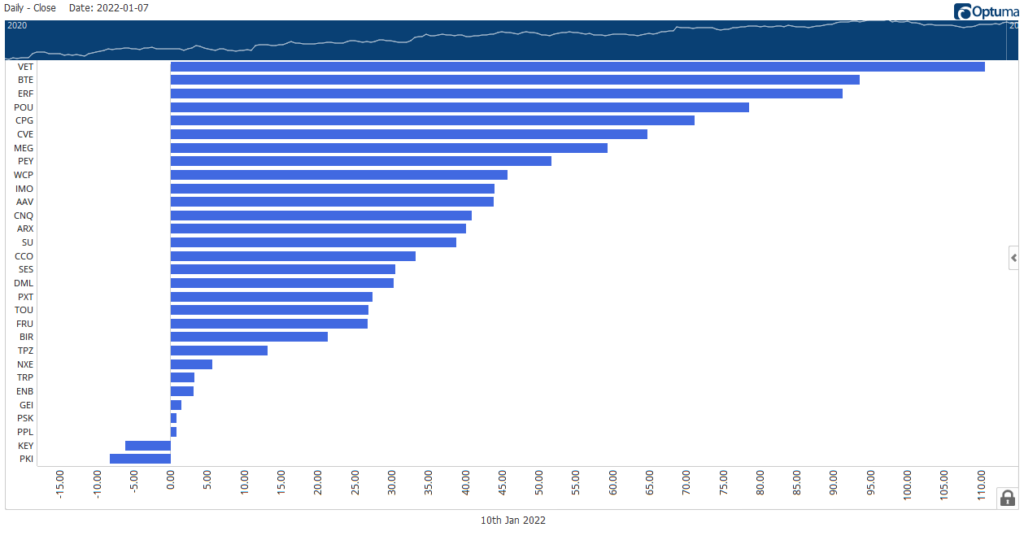
Vermilion Energy Inc., Baytex Energy Corp., Enerplus Corporation, Paramount Resources Ltd., Crescent Point Energy Corp., and Cenovus Energy Inc. exhibit strong momentum.
Assuming sector continuity of an accumulating market structure, relative strength expansion, and bullish momentum, then portfolio allocation to energy stocks remain desirable in 2022. After all, leading stocks are found in leading sectors.
Rate of Change (ROC) is a momentum oscillator measuring the velocity of price changes for a fixed time interval. A ratio is constructed from a simple function (100*P/Pn) of market price at the present day (P) and market price from a reference point (Pn). Below is a descending ranking of a simple 90-day ROC function highlighting stocks with the highest momentum – Vermilion Energy Inc., Baytex Energy Corp., Enerplus Corporation, Paramount Resources Ltd., Crescent Point Energy Corp., and Cenovus Energy Inc.
The momentum ranking simply initiates progressive analysis to be performed.