Major global indexes closed the week on downward pressure led by the tech-heavy Nasdaq Composite Index.
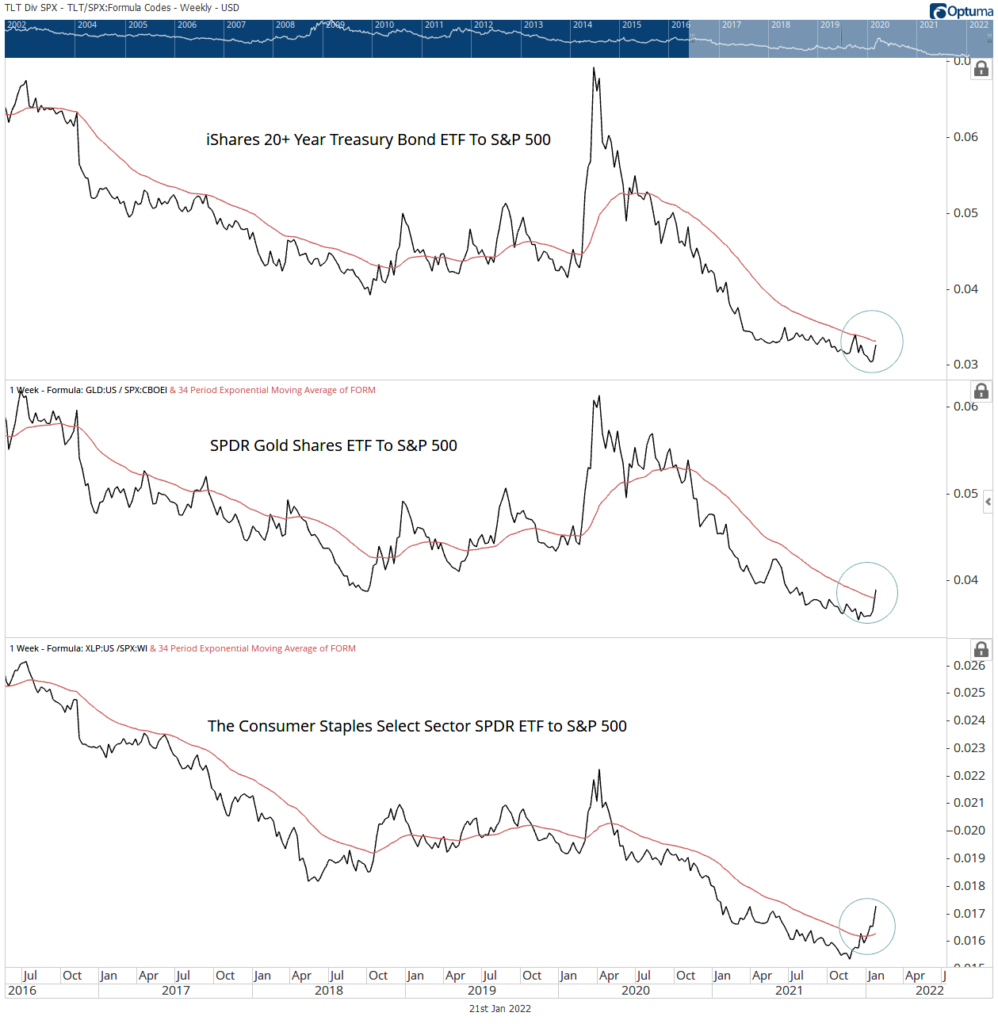
In periods of turbulence for equity markets, risk-on appetite wanes as investor preferences for ‘safe-haven’ securities increase. Assets like gold, US treasuries, consumer staples, and key currencies (Japanese yen, Swiss franc, US dollar, etc.) attract global investors seeking portfolio diversification benefits. The expanding relative strength of the iShares 20+ Year Treasuries, SPDR Gold Shares ETF, and the SPDR Consumer Staples Sector ETF to the S&P 500 highlight bearish sentiments in equity markets and flight to safety ensues. Although systematic risks are unavoidable, safe-haven assets have provided a cushion during bumpy rides, temporarily serving as a store of value.
Prospects of higher rates continue to weigh on equity markets. Global stock markets outside the United States, iShares MSCI ACWI ex U.S. ETF for reference, closed the week, down 3.12%, accentuating the broader sell-off. In the US, the Nasdaq Composite Index, S&P 500, and Dow Jones Industrial Average were negative across the board, -7.55%, -5.68%, and -4.58%. The Nasdaq, gathering the most attention entered the ambiguous correction territory, furthering bleak outlooks. Littered with growth stocks, the index, comprised of a 50% Technology sector weighting, continue to absorb flurries of punches to the chin as rate hike expectations intensify – potentially dampening corporate earnings and stock values. Up north, the S&P/TSX Composite Index and and S&P/TSX 60 followed the course, -3.45% and -3.56% respectively to end the week.
Relative strength in US treasuries pose concerns for equities, and risk must be kept on a very short leash.
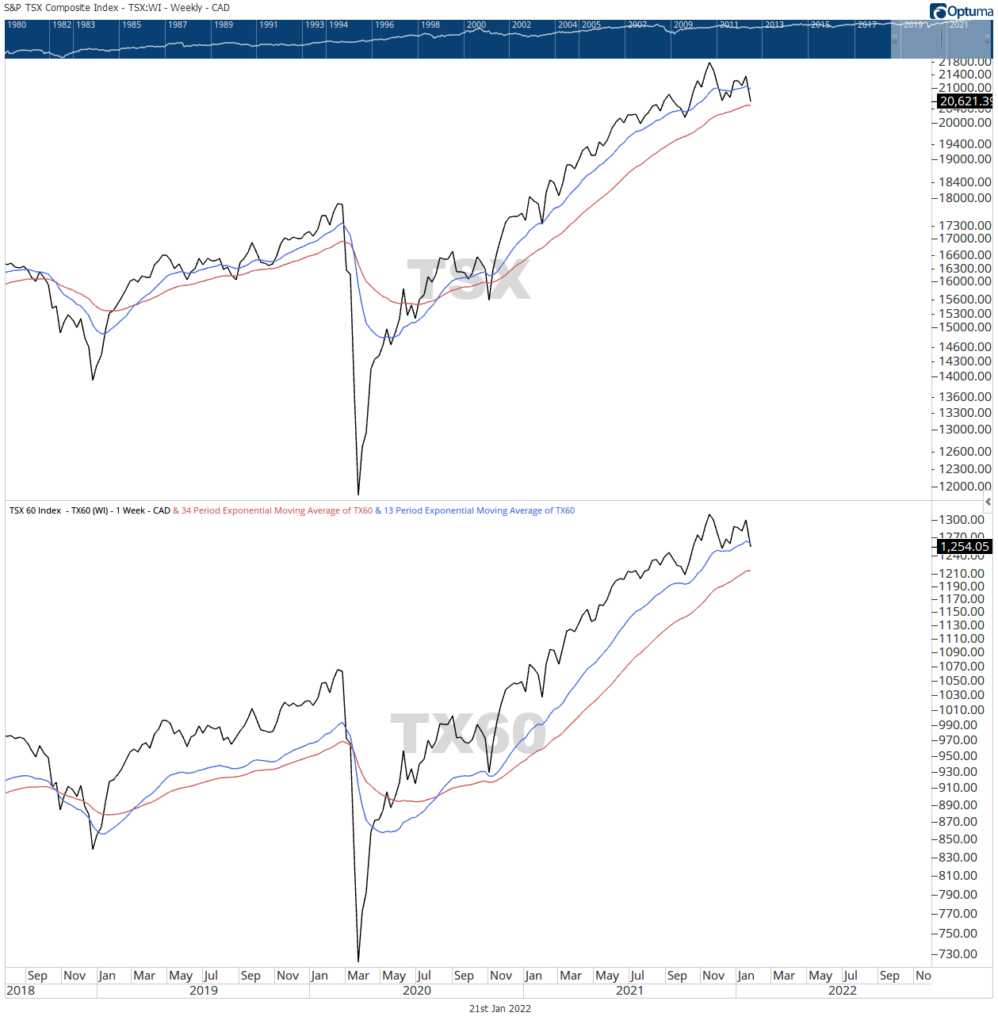
Objectivity can be difficult to come by as sell-offs amass and investor pessimism crowd headlines. Worry/confidence can lead to over/under-reaction and every emotion in between. A simple ‘game or bench’ model can supply needed neutrality. A model without complex inputs is often easier to interpret and follow. For instance, a weekly ’13/34′ exponential moving average model adds a few drops of clarity to muddy waters. And, interpretation is effectively simple – if the broader market’s short-term EMA trends above the long-term EMA – it’s still game time. When the inevitable bearish cross-over occurs – it’s time to substitute for the bench and reassess.
Notwithstanding current sentiments, the 13 EMA remains above the 34 EMA for both the S&P/TSX Composite Index and the S&P/TSX 60 – in short, it’s still game time. That said, the bond market is not to be disregarded. Relative strength in US treasuries pose concerns for equities, and risk must be kept on a very short leash.
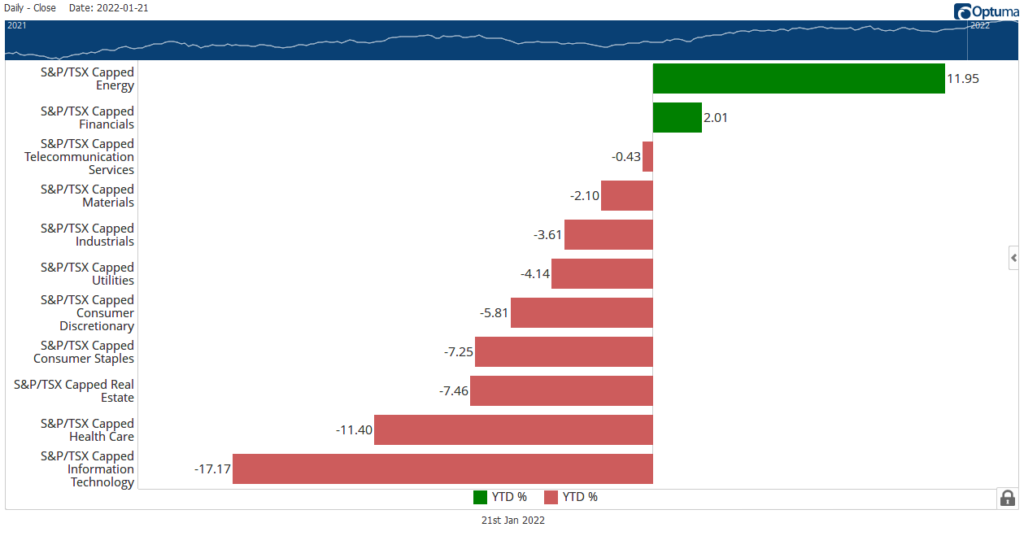
Leading the slide are Health Care (-9.0%), Technology (-7.7%), and the Consumer Discretionary (6.3%) sectors.
Year to date, the Energy and Financial sectors continue to hold, above choppy waters. Ending the week, the Health Care (-9.0%), Technology (-7.7%), and the Consumer Discretionary (6.3%) sectors led the declines. The reclusive Utilities (0.48%) sector ended the week on a positive note, up 0.48% – shedding light to the broader nervousness of market participants and stock piling on defensive assets.