
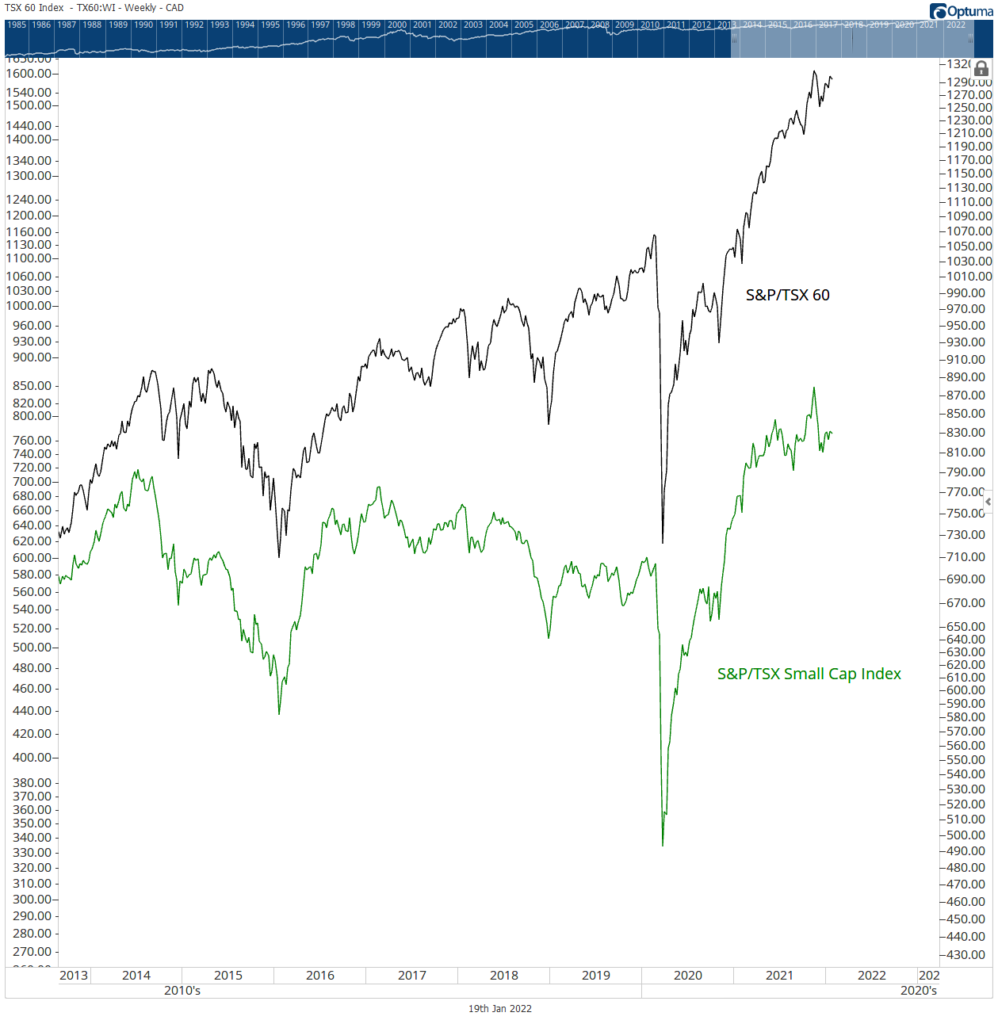
The S&P/TSX Small Cap Index has a five year compounded annual growth rate of 3.12% trailing the broader market.
During years of bullish equities, it’s common to see small cap equities leading the way and outperforming bluechips. With a five year compounded annual growth rate of 6.6% for Canada’s main index, 7.3% for the S&P/TSX 60, why is the S&P/TSX Small Cap Index not running circles around the larger and slower-moving S&P/TSX 60? The S&P/TSX Small Cap Index is a proxy of 229 small cap equities with a average market capitalization of $675 million. And, the S&P/TSX 60 Index is a proxy of heavyweights with an average market cap of $43,745 million. So, what’s causing performance lag for the small cap group? Is comparison even fair?
Financials was one of the best performing sectors in 2021. Materials was the second worst performing sector, 31.6% and 2.4% respectively.
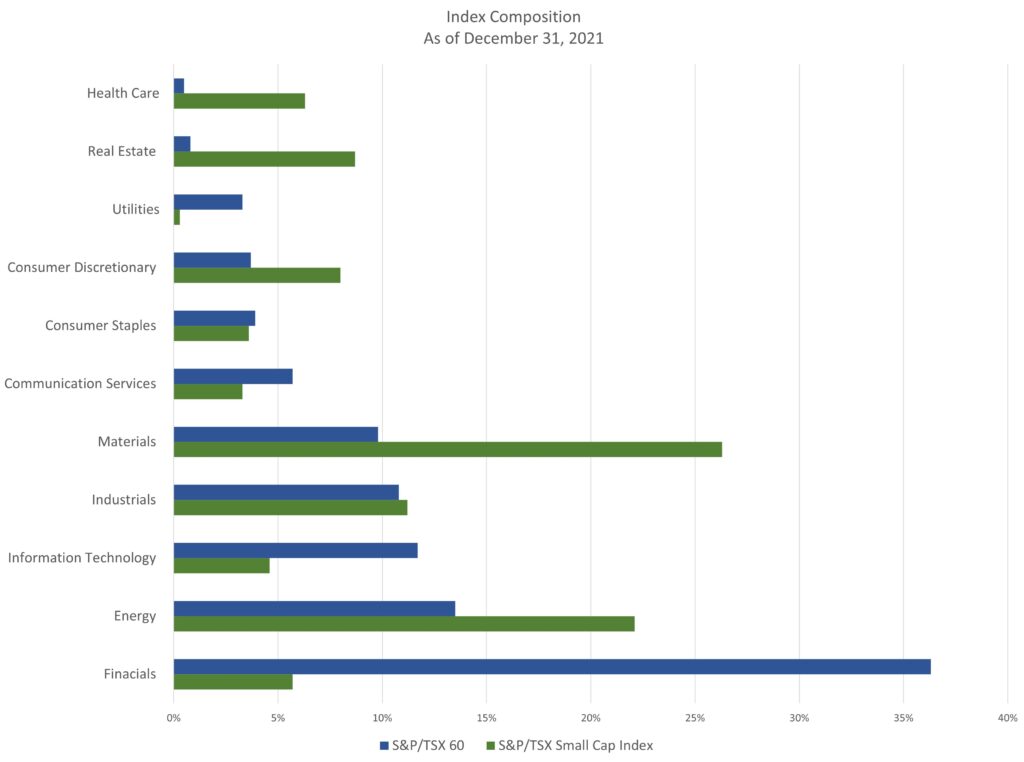
Sectors with the largest footprints hold greater influence to overall index performance. Quick tale of the tape – composition of the S&P/TSX Small Cap Index tilts towards Energy, Materials, and Industrials – amounting to 60% of the index. In contrast, the S&P/TSX 60 tilts to Financials, Energy, and Information Technologies – combining to 61% of the S&P/TSX 60. Composition of the two indexes are quite different making direct comparisons inaccurate.
Both S&P/TSX Small Cap Index and S&P/TSX 60 benefited from Energy gains in 2021. The Industrial sector returned 15.8% during the period, adding lift to the small cap index. And, the large cap index benefitted from gains in Information Technologies, 16.3%. Both sectors had similar weightings to their respective indexes. What happened with Financials and Materials?
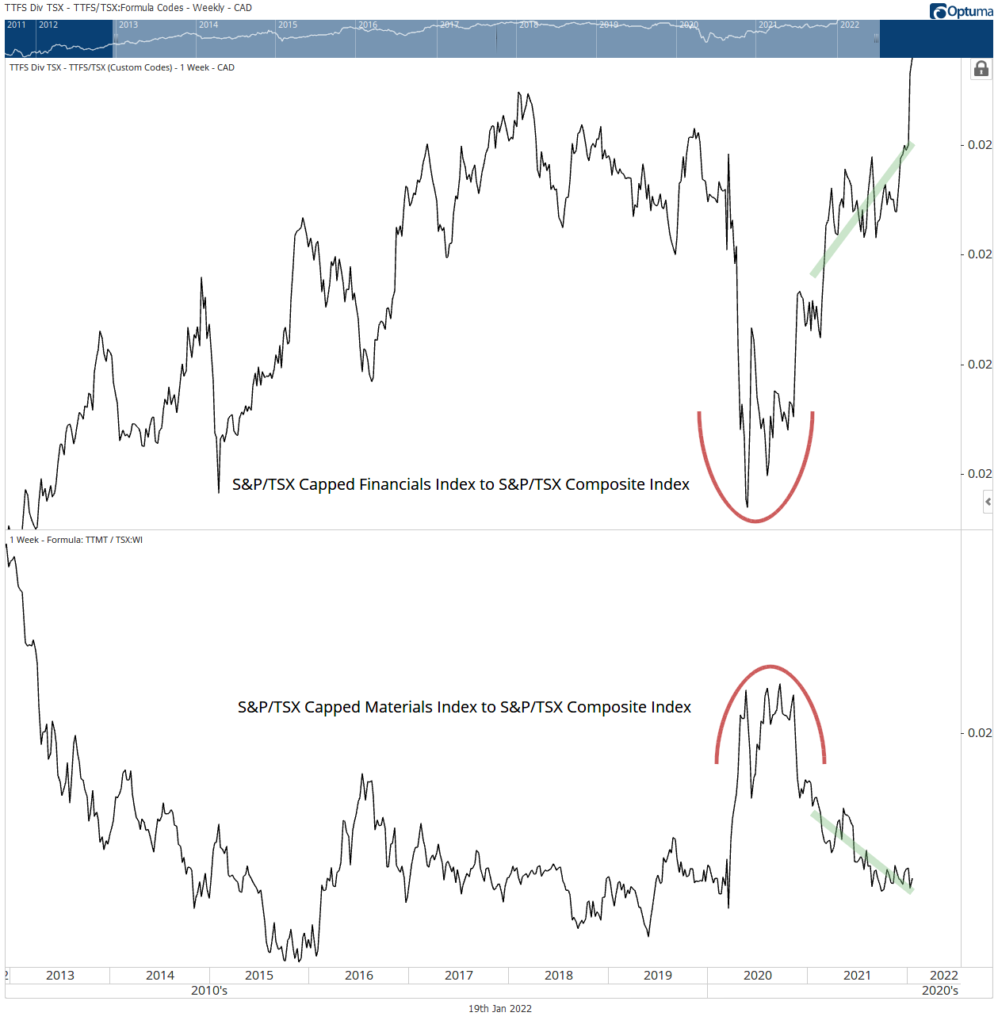
Financials was one of the leading sectors in 2021, while Materials was the second worst performing market sector, 31.6% and 2.4% respectively. The large cap index had a nearly 40% weighting in financials, and less than 10% weighting in materials. The small cap index’s heavier footing in Materials (26%) and lesser exposure to Financials (6%) contributed to underperformance. In 2020, accumulation developed in the Financial sector, while the Materials experienced distribution and deteriorating relative strength – setting the stage for 2021.
Materials include precious metals, mining, commodity chemicals, forest products, gold, copper, silver, etc.
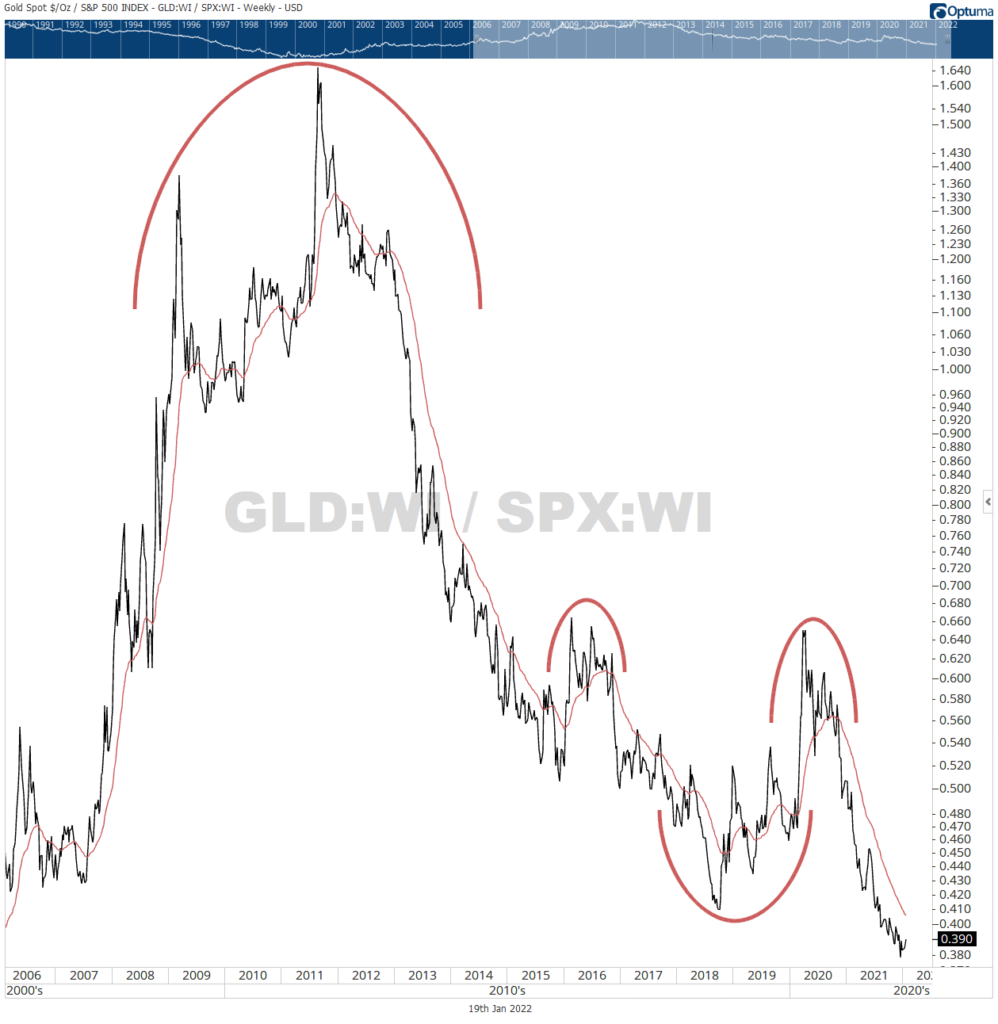
Ignoring gold when highlighting the Materials sector would be a complete no-no. Why? Gold exposure is a sector staple – accounting for 50% of the sector index, at the end of 2021. Gold tends to shine bright during market contractions, benefiting from inflows of safe-haven seeking capital. Conversely, in periods of a strong US dollar and bullish equity markets, gold can experience downward pressure. From 2011’s distribution to date, gold underperformed relative to the S&P 500, highlighting investor risk-on appetite for global equites. Gold lacked sheen in 2021, returning -3.8% – contributing to the Material sector’s underperformance which impacted the performance of the S&P/TSX Small Cap Index in 2021. How gold performs in 2022 will depend on supply/demand, the US dollar, and developments in global equity markets while markets price rate revisions. To wrap up, gold holds weight in the Materials sector, and Materials is a large component of the S&P/TSX Small Cap Index, thus having substantial influence to the small cap group.