
The US Dollar Index is down -1.6% year to date, giving back grounds of 11.5% from its high in Q4/2022. Relative weakness in the US Dollar resulted in grounds gained for major US trading partners — Swiss Franc, Japanese Yen, Euro, and the British pound. The overall trend in DXY is negative — signified by the downtrend in the weekly 13/34 weekly EMA model. Fluctuations in the US Dollar can reverberate across various markets, but it is primarily filtered through in the commodities market. Relative weakness in the dollar is a positive development for commodities, and vice-versa. The ‘Thomson Reuters/Jefferies CRB Index’ has been consolidating on the dollar’s relative weakness since Q2/2022, following a substantial decline of nearly 20% from summer highs. Year to date, The CRB Index is down -2.14% despite early advances in precious and base metals such as Copper and Gold, advancing 11% and 7%, respectively. The consolidation in crude oil and agriculture have weighed down overall index performance.
Bond investors are expecting central banks to cut interest rates during the later stages of the year due to expectations of an economic slowdown that will remedy inflation faster than the banks monetary actions.
On Wednesday, February 1st, the US Federal Reserve authorized a quarter percentage-point bump to the federal funds rate, decelerating the pace of monetary tightening. The announcement lifts the funds rate to a range of 4.5% to 4.75%.
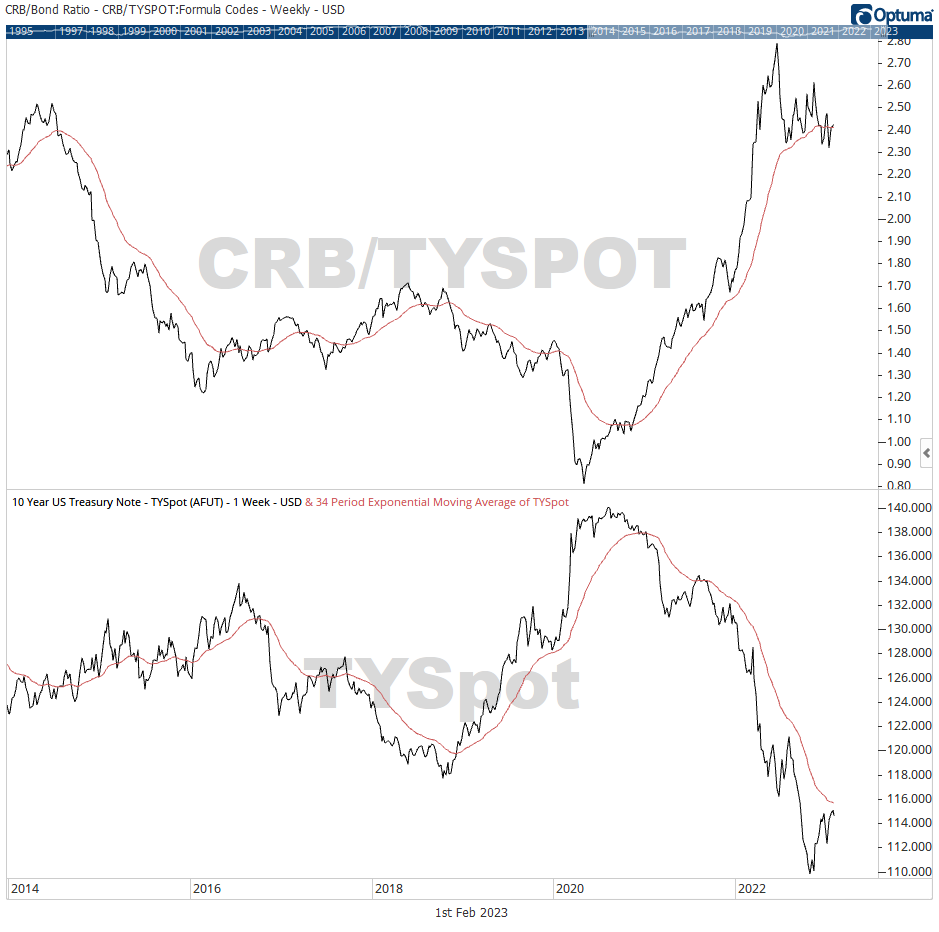
The Commodities/Bonds ratio continues to consolidate from Q2/2022 peaks into early 2023, potentially providing hints of ‘peak’ inflation. A falling ratio generally benefits rate-sensitive areas of the market, while a rising ratio favors staple commodities such as energy, gold, basic materials, and resource products – raising attention to rising inflation and interest rates, highlighting the positive correlation between commodity prices and bond yields. Yields on the 2-30 US Year Treasury bonds have reverted to their 34-weekly moving averages, resulting in advances in US bond prices. The US 10 Year Treasury Notes have gained nearly 2.8% since the 10 Year yields declined by nearly 20% from 2022 highs of 4.33%. AGG, the iShares Core U.S. Aggregate Bond ETF aiming to replicate the performance of a composite of the US investment-grade bond market has gained 3.8%, year to date. Bond investors are expecting central banks to cut interest rates during the later stages of 2023 due to expectations of an economic slowdown that will remedy persistent inflation problems quicker than the undertaken monetary actions. Investor demand for international bonds expanded in January as European Governments sold nearly $75 billion of new issues and roughly $60 billion were issued in emerging markets — an improvement in market activity.
Breadth expansion is notable on the advancement and nearly 85% of index constituents are trading above their respective 200 day moving averages. And, volatility, highlighted by the 20-period ATR, is contracting on constructive market developments.
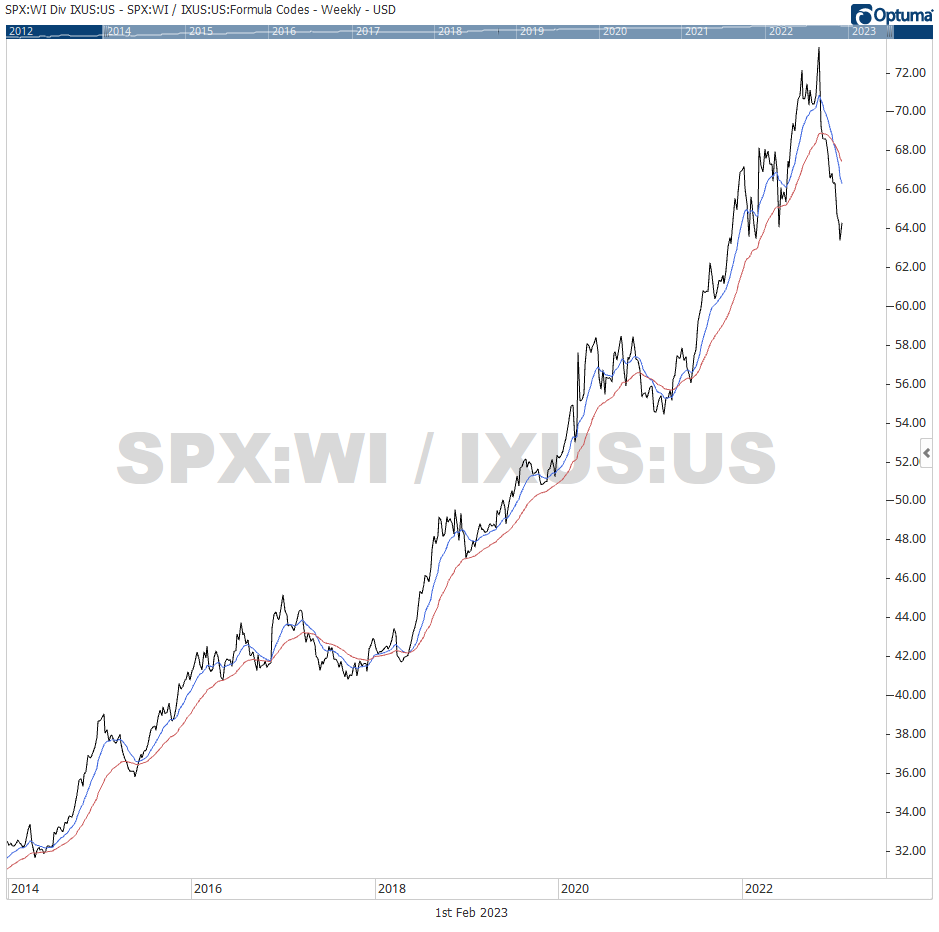
Gains in the equities market have been driven by investor expectations that central bank policies can avert an economic hard-landing, cooling inflation is near, and that central banks can pivot from restrictive policies to easing in the months ahead. Global equities, illustrated by IXUS, the iShares Core MSCI Total International Stock ETF seeking to track a composite of large-to-small capitalization non-U.S. equities has returned 8.55% for international-minded investors in 2023. With regional biases in Japan, the United Kingdom, China, Canada, and France, investors have benefited from the relative leadership in European markets and reduced exposures to growth-oriented industries that have depressed US equities. Developed markets, excluding the United States, are continuing to showcase relative strength against emerging markets such as China, Taiwan, India, Korea, and Brazil — encouraging North American investors to consider extending their scope beyond their own borders.
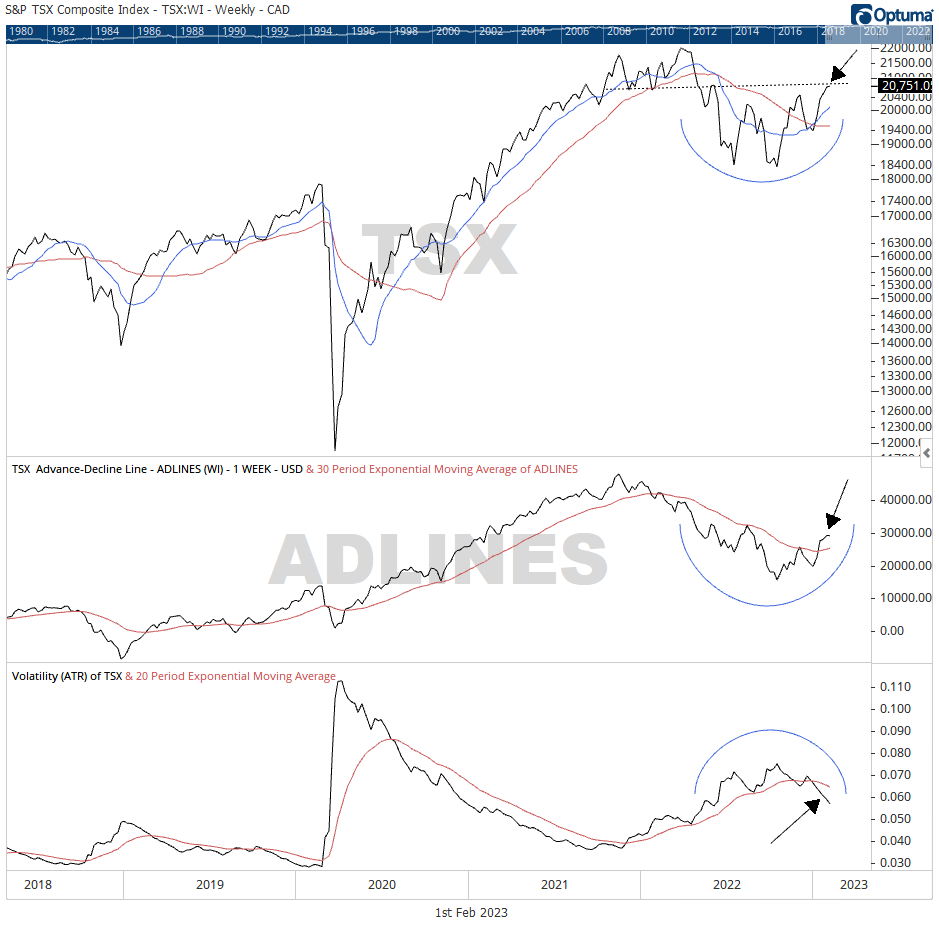
Home court, the TSX Composite Index shows early leadership to the S&P 500 on the strength of basic materials, particularly gold and mining companies. Our primary barometer is up 7%, while the TSX 60 — Canada’s blue chip index, and the TSX Smallcap Index are up 6..8% and 9.7% respectively. The headlining index advanced from its Q4/2022 lows and has seemingly absorbed overhead supply near an established resistance area of $20,500. Breadth expansion (rising TSX Composite Advance/Decline Ratio) is notable on the advancement and nearly 85% of index constituents are trading above their respective 200 day moving averages. As well, volatility, highlighted by the 20-period Average True Range, is contracting on constructive market developments. It will be worthwhile to monitor the developments in the credit market during the first half of 2023 and how the rate-sensitive sectors will respond. Cyclical sectors have thus far shown early market leadership, and while the United States has lagged international markets so far (including Canada), it would be too early to be counted out.