Last year’s laggards are this year’s early leaders — the S&P/TSX Capped Information Technology, S&P/TSX Capped Health Care Index, S&P/TSX Capped Real Estate Index; up 20%, 13.4%, and 10.5% respectively, compared to 2022 drawdowns of -35%, 57%, and -24%.
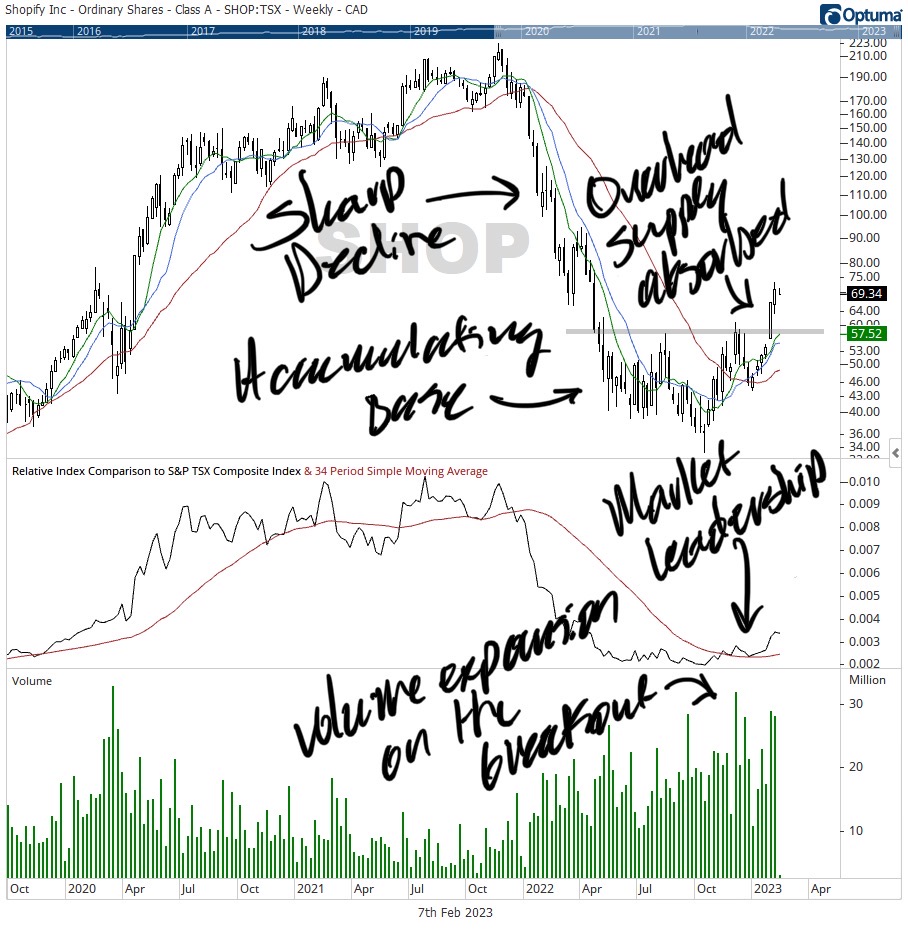
Should the broader market continue to develop constructively, ‘SHOP’ would be an excellent portfolio addition within a leading market sector.
The TSX Composite Index has re-gained roughly 16% from its October/2022 lows and remains above the resistance area of $20,500. While the breakout is recent, breadth expansion (AD Line) and contracting volatility (20-period ATR) are constructive developments (2023 has thus far been…). Major Canadian indices are in overbought areas — progress in an up-trending market. Sector advances are broad and the percentage of index constituents trading above their 200 day moving averages have registered a breadth high of 85%. Early out the gate, last year’s laggards are this year’s early leaders — the S&P/TSX Capped Information Technology, S&P/TSX Capped Health Care Index, S&P/TSX Capped Real Estate Index; up 20%, 13.4%, and 10.5% respectively, compared to 2022 drawdowns of -35%, 57%, and -24%.
As the market advances, a sector of interest is the S&P/TSX Capped Information Technology group —accounting for less than 7% of the TSX Composite Index. The sector sharply declined on the setting of aggressive monetary policies that significantly squeezed the growth and cyclical areas of the market; leading to lower margins, reduced earnings, shrinking company valuations, increased investor pessimism and beleaguered share prices — significantly underperforming the index which had benefited from the strength in resources during 2022.
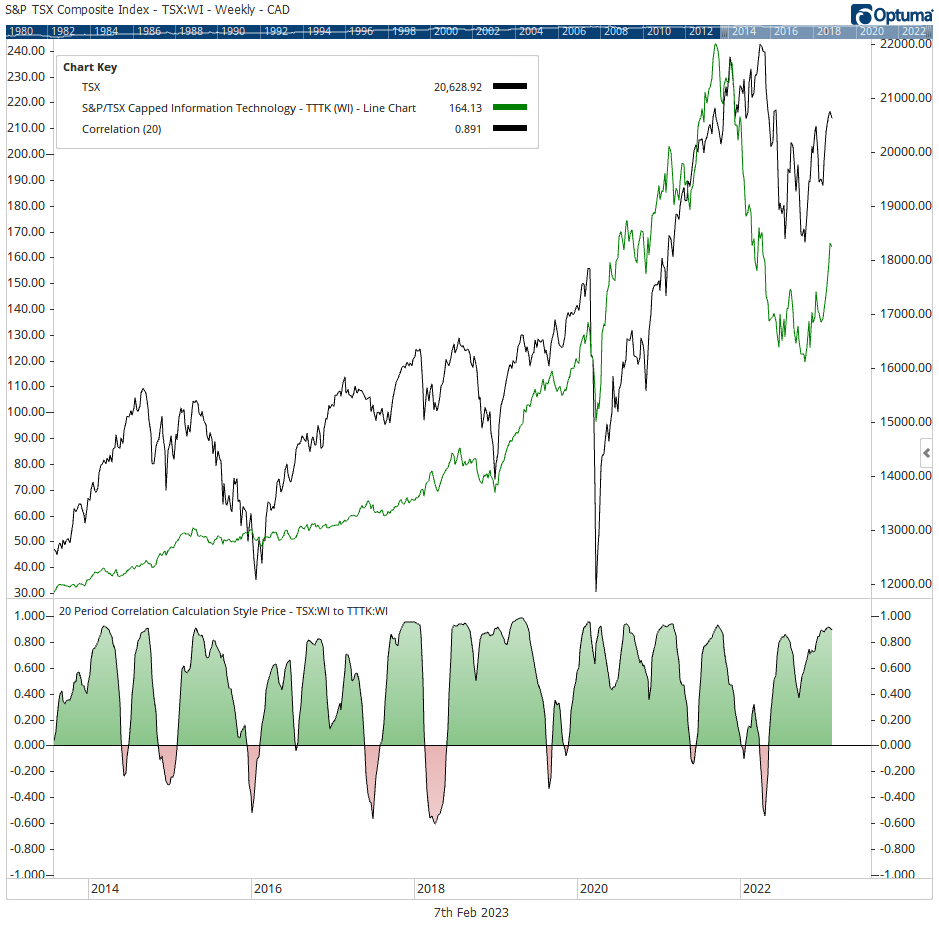
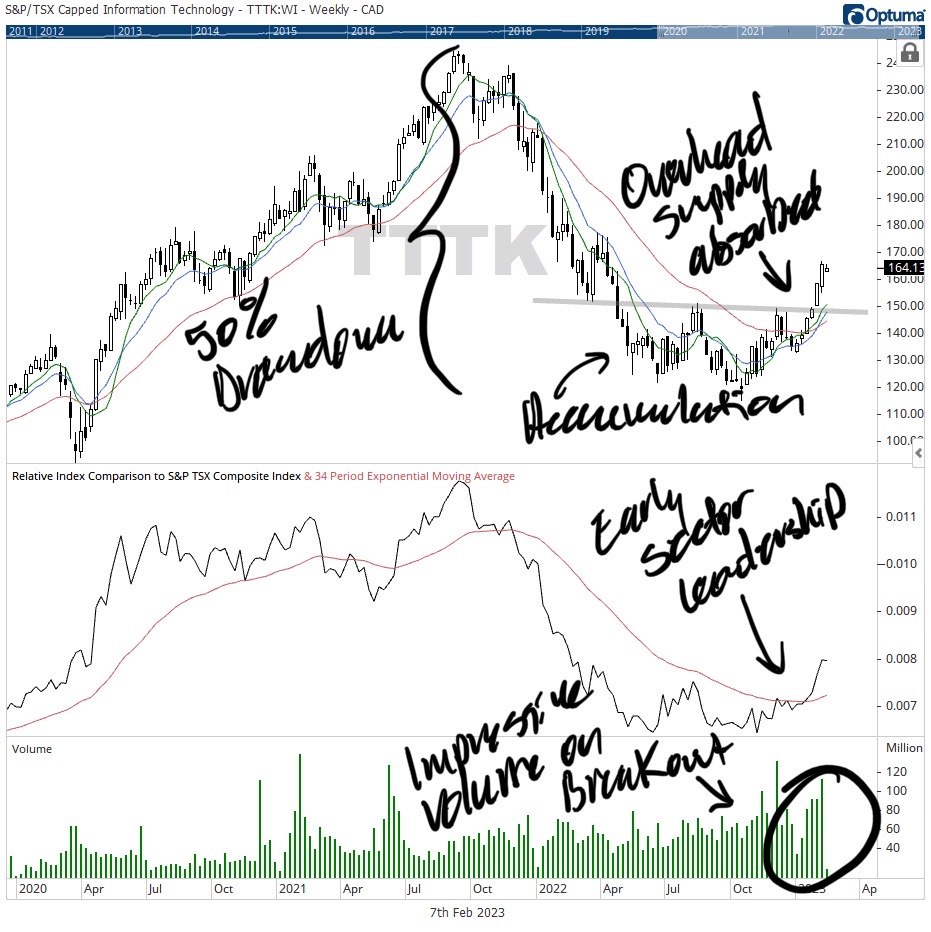
Although, the sectors’ footprint is relatively small within the index, the high positive correlation between ‘index/sector’ is evident and a rising tide tends to lift all boats. The sector, following a drawdown from ‘peak-to-trough’ of 50% developed into accumulation supported by expansive trading volume and a committed breakout from the sectors trendline, late-January. The upwards slope of the relative comparison ratio suggests that the cyclical group is driving broader market returns. Under the hood, Shopify Inc. (SHOP) is re-establishing itself as a sector leader — gaining 47% year-to-date after shedding 85% of its share price between Q4/2021-Q4/2022. In similar fashion, ‘SHOP’ displayed a forceful breakout from accumulation as the security exhibited relative strength to the index on significant volume as overhead supply was absorbed on persistent demand. Should the present market narrative continue to develop, ‘SHOP’ would be an excellent portfolio addition within a leading market sector — particularly at the early stage of price expansion and an improved return-to-risk ratio should a throwback occur near breakout levels on lacklustre volume.