
With supplementing information from the commodities market, yield inversion, potential widening in credit risk, and mixed market internals, it’s imperative to stay with the current trend, with the needed aptitude to adapt to trend changes. If and when the market transitions to a declining structure, signaled by descending peaks and troughs, it will do so with a greater ‘weight of evidence’ for weakness. The conflicting information, while valuable, is just that — information, and it’s not actionable until the market proves otherwise.
Since sliding 13.25% from Q4/2022 peaks, the US Dollar Index has remained in a sideways trend. Relative to major US economic partners, the greenback is up 3.65% YTD. Its value can be influenced by several factors — US economic outlooks, GDP growth, geopolitics, supply and demand dynamics, and global investor sentiment. Fluctuations in value tends to reverberate throughout the commodities market, being that it’s the common settlement currency for global commodities trading. Generally, the two have an inverse relationship — strength in the greenback tends to put downward pressure on commodity prices, and vice-versa. While their tendency is to move inversely, the relationship does break down from time to time, as seen during 2021-2022 — global supply-chain disruption drove a surge in commodity prices and demand for dollar rose in tandem with rising yields and market uncertainties.
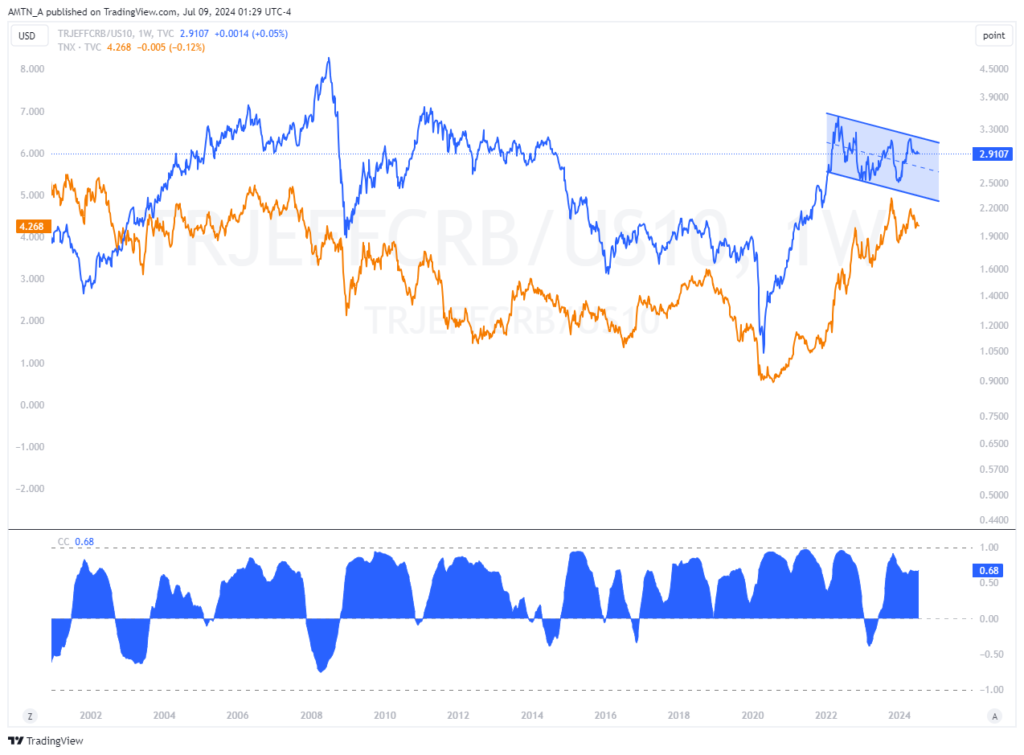
The Thomson Reuters/Core Commodities Index (11.08% YTD) aggregates futures price of a basket of various commodities — the value of the index will fluctuate based on these commodities. Using Invesco commodity-based ETFs as proxy of relative performance, commodities have broadly performed well during the first half of 2024 — the Invesco DB Precious Metals Fund (17.39% YTD), Invesco DB Agriculture Fund (15.77% YTD), and the Invesco DB Base Metals Fund (11.86% YTD) have advanced sharply from their respective Q1/2024 troughs. Under the hood, commodities such as Cocoa (84.61% YTD), Silver (29.91% YTD), Orange Juice (25.79% YTD), Copper (19.19% YTD), Crude Oil (14.57% YTD), and Gold (14.44% YTD) have contributed to the broader strength in index performance. As the US Dollar affects commodities, commodities influence interest rates. Persistent strength in the commodities market is associated to inflationary environments, which places upward pressure on interest rates, as seen in 2020-2022, during and following the aftermath of COVID-19. The ‘Commodities/Bond’ ratio advanced sharply from 2020-2022 and has since been consolidating without an objective resolve. An upwards resolution, from the price channel would support continuous relative strength in inflationary sectors such as Industrials, Energy, and Basic Materials — often observed during the later stages of an economic expansion of the business cycle. Conversely, a declining ratio would favor rate-sensitive market sectors such as Consumer Staples, Utilities, Finance, and Healthcare. Correlation between the Commodities/Bond ratio and the US 10-year treasury yields is generally positive with commodities normally leading the dance as business activities taper on increased cost of borrowing from rising rates.
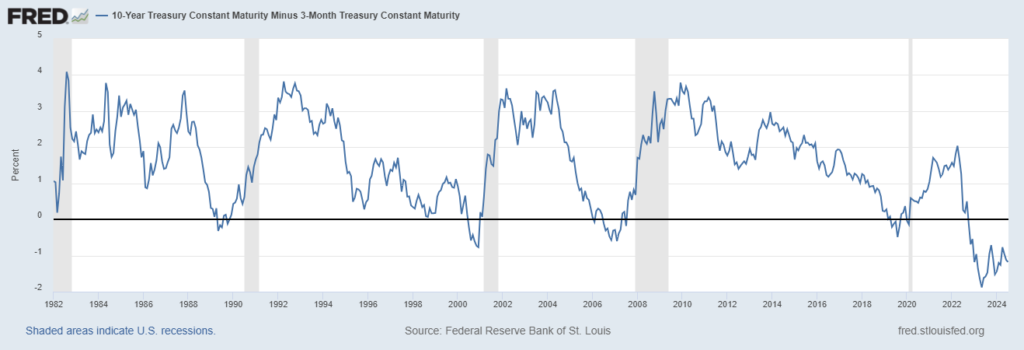
Federal Reserve Bank of St. Louis, 10-Year Treasury Constant Maturity Minus 3-Month Treasury Constant Maturity [T10Y3M], retrieved from FRED, Federal Reserve Bank of St. Louis; https://fred.stlouisfed.org/series/T10Y3M, July 8, 2024.
The 10-year treasury yields broke out of a secular downtrend in Q1/2022, marking a potential transition to ascending peaks and troughs in future interest rates, not seen since the 1950s-1980s. Currently at 4.28%, the 10-year yields remain in an uptrend — until the market tells otherwise. While it’s no longer headlining news, the US 10-year and the 3-month treasury (5.36%) yield curve has been continually inverted since Q4/2022, increasing the odds of an economic recession. The yield curve plots yield to maturities of government bonds across various maturities. The shape of the yield curve is a significant and dependable barometer of economic health for investors. A normal yield curve is a period of economic expansion, and an inversion, although rare, occurs when short-term rates exceed long-term rates, reflecting investor outlooks of severe economic slowdown ahead. Since the 1980s, every economic recession (shaded areas) has been preceded by negative yields. Its foretelling abilities is not perfect, it has its shortcomings. For one, the period of time between yield inversions and recorded recessions has varied from eight months to two years — quiet a wide range. Also, the magnitude and length of potential forthcoming recessions while all important to know beforehand, are of course indeterminate. The credit spread between the iShares High Yield Corporate Bond ETF and the iShares 3-7 Year Treasury Bond ETF (‘HYG/EIE’) hold a positive correlation with US equities — carving peaks and troughs at similar times. Divergences from their central tendencies is valuable information. Presently, the S&P 500 ($5,572) is hitting all-time highs, while the weekly trend in the HYG/IEI ratio has seemingly flattened. Should the ratio rollover from current levels, it would imply increasing credit risk, signaling risk-off investor sentiment. In contrast, narrowing spreads (HGY/IEI ratio rising) is supportive of expanding strength in the economy, which is a positive backdrop for equities.
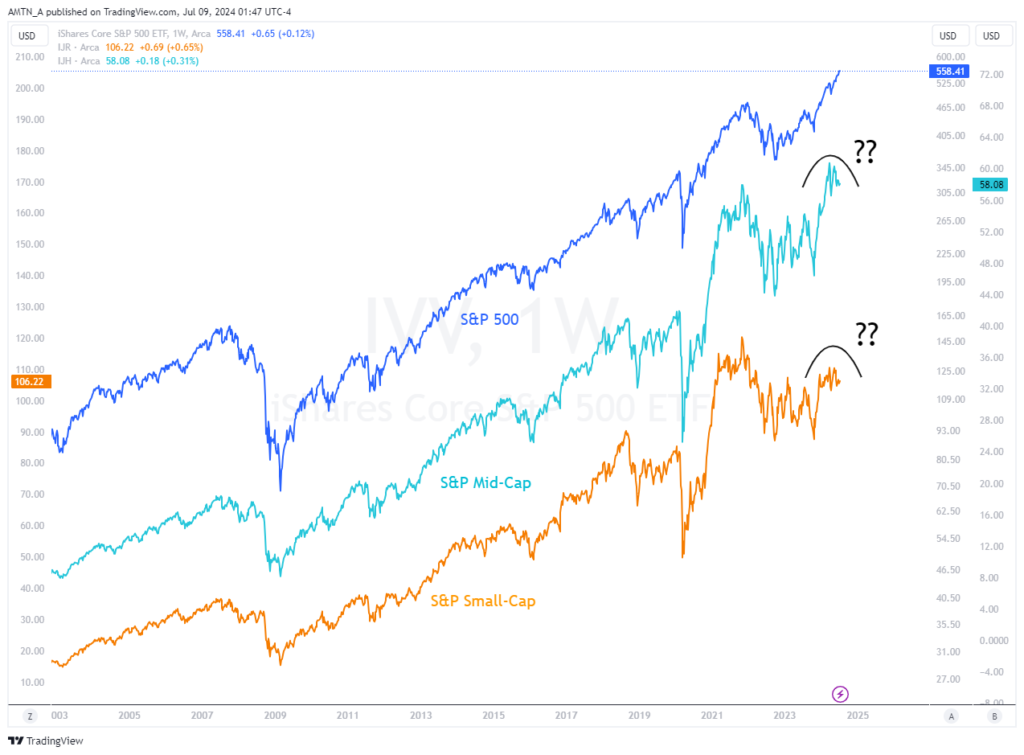
The Nasdaq (22.60% YTD), S&P 500 (16.84% YTD), and the Dow (4.39% YTD) continue to advance. Leading the way in sector relative performance are Information Technologies (21.82% YTD), Communications (19.69% YTD), Financials (10.19% YTD), and Utilities (8.35% YTD). On a relative strength basis, the iShares S&P 500 Growth ETF (27.79% YTD) continues to outperform the iShares S&P 500 Value ETF (4.46% YTD), highlighting strength in the technologies and semiconductor industries. Hitting all-time highs of $5,572, the S&P 500 surged 56% from Q3/2022 lows to date. However, despite the market’s persistence of higher-highs, the market internals are conflicting. Firstly, sector participation isn’t wide-ranging — Information Technologies and Communications remain the two sectors with relative strength to the broader market. Although US large-cap equities (iShares Core S&P 500 ETF, 16.91% YTD) continue to drive US equity returns, mid-cap equities (iShares Core S&P Mid-Cap ETF, 4.78% YTD) and small-cap equities (iShares Core S&P Small-Cap ETF, -1.88% YTD) have been lackluster and are seemingly consolidating at current levels. During market tops, large-caps tend to follow last, after small-to-mid cap equities have transitioned to declining market structures — often the order is mirrored from market bottoms to advancing markets. Participation across market capitalization is symptomatic of a strong bullish market — a contrast to current environments. Secondly, as a gauge of investor sentiment, the ‘Technologies/Utilities’ ratio is approaching Q1/2024 peaks and failure to sustain the advance could spell turbulence ahead for growth-oriented sectors as a declining ratio would imply relative strength in defensive sectors — Utilities, Healthcare, and Consumer Staples. And lastly, while market breadth remains strong with 64% of S&P 500 constituents trading above their 200-day averages, it’s a contraction from Q2/2024 levels of 81%, diverging from the index’s price action of higher-highs.