
The U.S. Dollar Index, currently trading at $99.25, reflects a period of depreciation against its major trading partners.
After a sharp 13% slide in the first half of 2025, the index entered an accumulation phase to establish a floor. Year-to-date gains remain a marginal 0.45%, stifled by persistent macroeconomic headwinds. The index is primarily constrained by cooling U.S. economic data and expectations of further rate cuts, both of which erode the U.S. yield advantage. Furthermore, mounting concerns over U.S. sovereign debt and global easing policies have dampened demand for the greenback. This pressure is compounded by a capital rotation toward international markets, as investors seek higher-yielding or growth-oriented foreign assets.
Thomson Reuters/Core Commodity CRB Index has decisively shifted into an advancing market structure—will bond yields follow?
This multi-year sideways trend was primarily a function of the index’s heavy concentration in Energy (39%) and Agriculture (41%), which effectively neutralized parabolic gains in Precious Metals—a sub-sector accounting for just 7% of the total weighting. This period of stagnation finally resolved to the upside in early February 2026, sparked by a sharp resurgence in global energy prices.
Currently, the CRB Index is posting a 19.45% YTD gain, underpinned by strength across the following sub-sectors, proxied by:
- Invesco DB Energy (42.8% YTD): Acting as the primary engine of the recent breakout, the sector has been propelled by a 48.21% advance in WTI Crude, at $87.90. This move reflects a significant geopolitical risk premium as markets price in escalating tensions across the Middle East.
- Invesco DB Precious Metals (18.60% YTD): Momentum remains robust, led by Silver (19.72%) and Gold (17.57%). The latter has reached new cyclical highs ($5,626) as investors increasingly hedge against potential currency debasement.
- Invesco DB Base Metals & Invesco DB Agriculture: these sectors have offered subdued gains of 4.88% and 1.84% YTD, respectively.
The current landscape is defined by a notable divergence between resurgent commodity prices and a consolidation in the US 10 Year Yields.
Since 2022, U.S. Government Bond yields (US10Y) have remained range-bound, currently holding near 4.21% despite a strong advance in commodities. Notably, the Bloomberg Commodity Index (BCOM, 20.95%) broke out of a two-year basing pattern in late 2025, fueled by WTI’s early 2026 surge. This muted reaction from the bond market may suggest that the market is viewing the commodity spike as a transitory supply-side shock rather than a signal of entrenched inflation. The trajectory of yields in the coming quarters will serve as a critical barometer: a decisive move upward would validate the “re-inflation” narrative, while a sustained break lower would signal a shift toward a cooling economy.
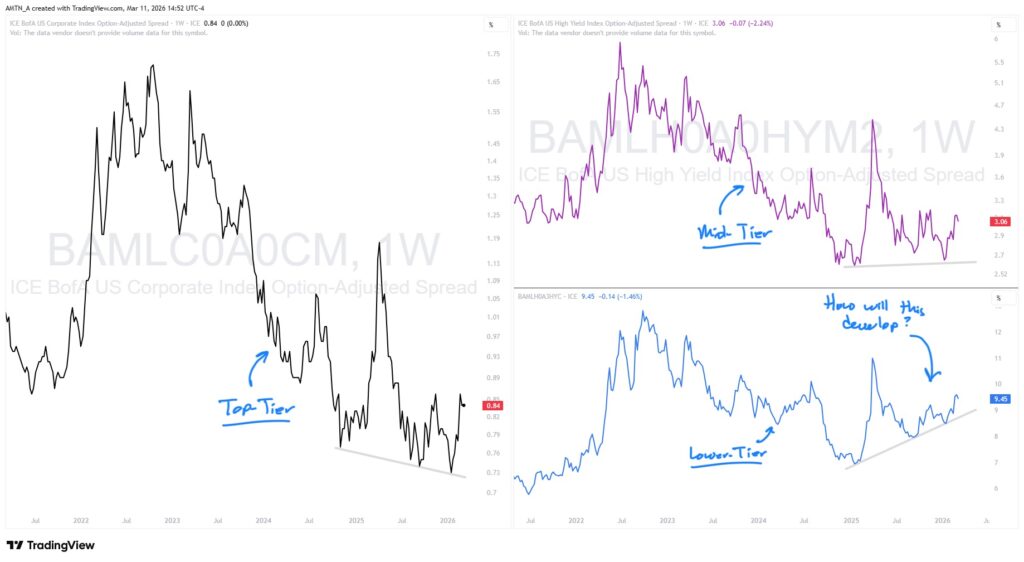
While the normalized yield curve currently points reflect a steady economic environment, internal fractures are beginning to appear within credit markets. Broad indices, such as the ICE BofA US Corporate (0.84%) and High Yield (3.06%), remain stable at the mid-to-upper tiers. However, the ICE BofA CCC & Lower Index (9.45%) has seen widening spreads, indicating potential localized credit stress for distressed issuers sensitive to rising borrowing costs.
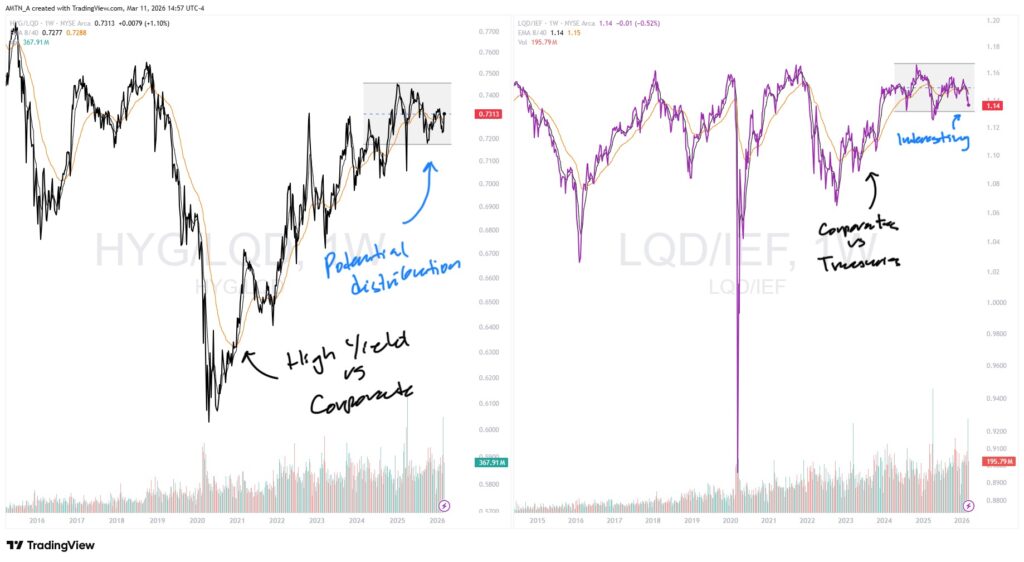
This “potential cracking” at the bottom of the credit tier may soon manifest in relative strength ratios:
- iShares iBoxx High Yield Corporate Bond ETF vs. iShares iBoxx Investment Grade Corporate Bond ETF: This ratio has entered a period of consolidation—a breakdown here would signal a rotation toward blue chip debt as default fears rise.
- iShares iBoxx Investment Grade Corporate Bond ETF vs. iShares 7-10 Year Treasury Bond ETF: Currently in a distribution phase, a resolution to the downside would indicate a broader flight to safety, suggesting that concerns over economic stability are beginning to outweigh the appetite for corporate risk.
The S&P 500 maintains a resilient advancing structure, supported by a positive weekly 8/40-period EMA trend filter and a modest -0.72% YTD loss.
Beneath the surface, market internals suggest healthy underlying conditions; approximately 53% of index constituents are trading above their 200-day Simple Moving Average (SMA), contracting from prior levels. Relative strength in the S&P 500 Equal Weighted Index, confirms that performance has been a broad sector participation rather than a narrow group of mega-cap leaders.
In parallel, the Dow Jones Industrial Average (-0.67% YTD) continues to exhibit an advancing structure, despite testing it’s internal 40-Week EMA. In contrast, the growth-oriented Nasdaq has struggled, posting a -2.35% YTD decline. The index currently sits at a critical technical crossroads as it tests its 40-week EMA—a level that has served as a line in the sand between bull and bear regimes. Price action at this juncture over the coming weeks will be pivotal. A sustained failure to defend this support would suggest growing investor skepticism regarding the “Artificial Intelligence” narrative and broader growth valuations. Such a breakdown would signal a structural shift, transitioning the tech-heavy index out of its current distribution phase and into a definitive declining trend.
While the MSCI ACWI (All Country World Index) is up 1.10% YTD, the primary engine of global momentum has decisively shifted away from the United States.
This structural transition, which began accelerating in early 2025, has seen the MSCI ACWX (ACWI ex-US) significantly outperform domestic equity markets, posting a robust 4.41% YTD gain. This divergence highlights a deepening global recovery narrative and a strategic rotation away from U.S.-centric growth toward international value. This shift has been catalyzed by a softening U.S. dollar and increasingly attractive relative valuations abroad.
The international strength story is being driven by outsized performance in several key regions, as evidenced by their respective iShares Country ETF proxies:
- iShares MSCI Brazil (16.78% YTD): Currently leading the global complex, Brazilian equities have surged as a primary beneficiary of the energy bull market and elevated industrial commodity prices.
- iShares MSCI Japan (6.07% YTD): Japanese markets continue to attract heavy institutional inflows, bolstered by ongoing structural corporate reforms and a favorable export environment that has maintained the Nikkei’s resilience.
- iShares MSCI United Kingdom (5.25% YTD): Characterized by a heavy concentration in “old economy” sectors—specifically banking and energy majors—the UK has emerged as a major destination for capital rotating out of high-multiple technology stocks.
- iShares MSCI Canada (4.97% YTD) & iShares MSCI France (-1.76% YTD): Both markets have provided steady support to the international index. Canada has gained significant tailwinds from its resource-heavy composition, while France has benefited from stabilizing industrial demand across the Eurozone.
The S&P/TSX Composite Index remains in a definitive advancing market, posting a 4.66% YTD gain.
The TSX has most recently shown stable breadth—approximately 77% of its constituents trading above their 200-day SMA. However, the most compelling narrative lies within the market capitalization breakdown: while the blue-chip iShares S&P/TSX 60 Index is up a solid 3.13%, the iShares S&P/TSX Small Cap Index has posted a 14.79% YTD. This performance was driven by intense investor appetite for higher-beta resource plays, particularly within the junior mining space as gold and silver reach multi-year highs. The recent momentum in the TSX is anchored by clear sector leadership that have aligned with the broader global commodities rally:
- Materials (18.02% YTD): As the top-performing sector, Materials has benefited directly from the parabolic moves in precious metals and industrial commodities.
- Energy (26.04% YTD): This sector continues to provide a significant tailwind as WTI Crude prices escalate in response to persistent Middle Eastern supply risks.
- Broad-Based Support: Beyond the resource trade, gains in Utilities (8.00% YTD), Industrials (3.66% YTD), and Communications (+7.29% YTD) suggest that the rally has been supported by domestic stability and defensive positioning.
The TSX’s outperformance relative to U.S. benchmarks has been a direct result of its unique structural composition. Canada’s resource-heavy footprint has allowed the index to participate in the upside of the Materials and Energy surge while effectively insulating itself from the “AI fatigue” and valuation contractions currently pressuring its U.S. counterpart. By maintaining a significantly lower weighting in Information Technology (9.7% in the TSX vs 34.4% in the S&P 500), the index has been positioned as a primary beneficiary of the global rotation into hard assets. This divergence has marked a definitive shift in leadership, as the old economy sectors has served as the engine of the Canadian market’s relative strength.
The flashing of amber lights signal tighter risk management.
The S&P/TSX Composite has undergone a powerful rally, advancing approximately 56% from its 2025 lows to its all-time high of $34,544 in early March. However, while the index continues to trade near all-time highs, a notable divergence is emerging between price action and underlying technical health. Specifically, the gains observed since late 2025 have not been corroborated by momentum oscillators such as the MACD, nor by significant capital inflows as shown by the Money Flow Index (MFI).
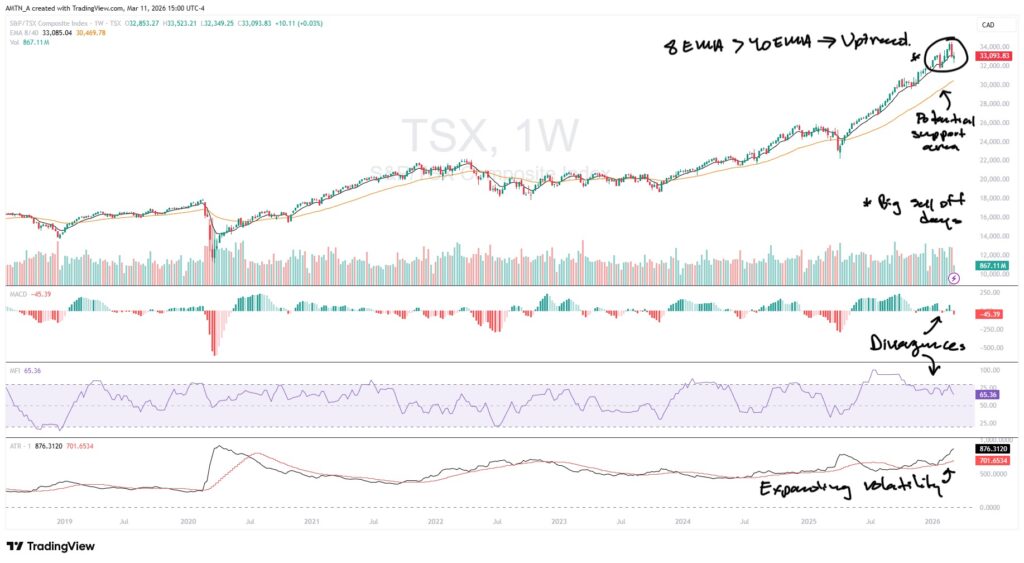
Furthermore, the Average True Range (ATR) has been steadily expanding—a signal that the index is ascending into a regime of heightened volatility. While these metrics warrant a cautious outlook, they currently serve as warning signals rather than a definitive reversal. A structural trend change would require confirmation via a sustained negative cross in the 8/40-week EMA, accompanied by a “lower-lows” pattern below the long-term trend filter.
Objectively, the primary trend remains intact for however long that may be. Nonetheless, the lack of investor conviction at these record levels suggests a posture of prudence is required. Market participants should remain alert for broad deterioration that could signal the end of this expansive cycle—a flight to safety across the credit markets would be a leading indicator of such a shift. While the trade remains with trend, active risk management should be the primary focus going forward.