
The S&P/TSX Composite Index, considered a resource biased index, has greatly benefited from the rise in crude and the overall performance in the Energy sector.
Energy has continued to be the leading sector in 2022, up nearly 68% year to date. In 2021, the sector was also the market leader, nearly finishing the year with gains of 80% on the backdrop of ascending crude oil prices which rose by 55% during the period. The S&P/TSX Composite Index, a resource biased benchmark, has greatly benefited from the rise in crude oil prices and the overall health in the Energy sector. This greatly contributed to relative strength performance to US indices which exhibit substantial tilts toward technology and growth-oriented industries, and substantially less exposure to commodities and energy, unlike its northern counterpart.
The volatile equities market has taken a toll on major indices around the world. The iShares MSCI ACWI (ACWX) which excludes United States is down 11.50% year to date. However, the the global ETF proxy has declined by 23% from its peak observed in 2021. ACWX serves as proxy to gauge equity performance outside the United States. Geographical exposure includes Japan, United Kingdom, China, Canada, France, Switzerland, Australia, Germany, Taiwan, among other countries. The world is interconnected and sever market corrections tend to reverberate across global indices and market sectors.
In the United States, the commonly watched Dow Jones, Nasdaq, and S&P 500 are down in similar fashion; -8.50%, -12.36%, and -21.27%, year to date. From all-time-highs to intraday lows, the American indices have declined by 17.2%, 32%, and 21% respectively. The theme of contractionary rate policies, Ukraine/Russian war, strong resurgence in commodities, persistent inflation, and differing global economic recoveries post COVID have made global equity markets volatile and difficult to navigate through. Strength in commodities, particularly in crude oil/energy sector, has sheltered the TSX Composite. From Q1/2022 highs to 2022 intraday lows, the index has fallen by 12.3%, not nearly as impacted as its southern counterparts.
For the TSX to resume a bullish trend, breadth expansion needs to improve – more stocks need to be advancing to support a sustained rally.
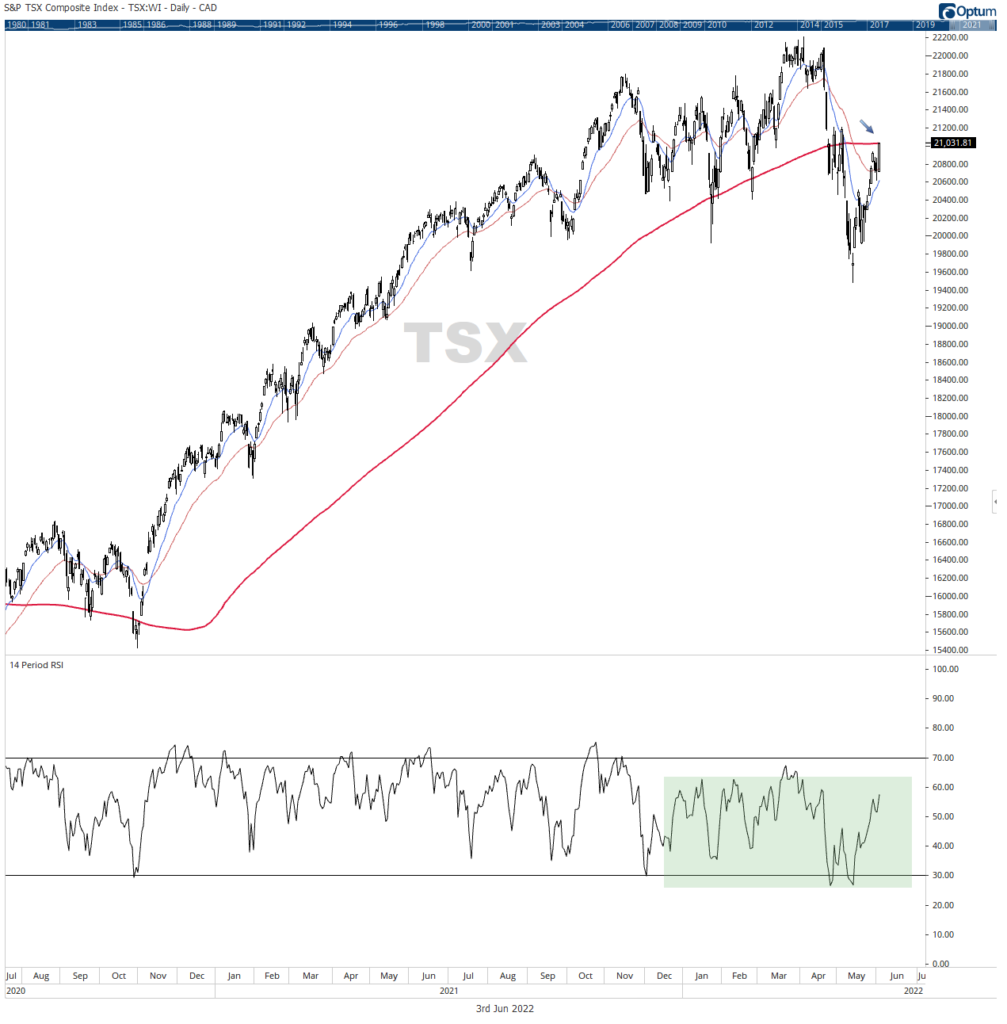
The S&P/TSX Composite Index rests below its 200 day moving average, and that is negative for long-only market participants. Assuming long positions against the trend is a difficult proposition as the directional bias in price action is downwards. A rising tide lifts all boats and is therefore much easier to long the market when the market trend is up, displaying a pattern of ascending support levels across the broader market. This ascending price action should be supported by breadth expansion and the lack of would raise caution to suspect and assess validity of short-term market rallies.
Current market breadth:
- The TSX advance/decline line suggests that more stocks are declining than the number of stocks advancing which is a sign of market weakness.
- % of stocks trading above there 20 day SMA – 95%.
- % of stocks above there 50 day SMA – 30%.
- % of stocks above there 200 day SMA – less than 25%.
The 14-period RSI oscillates near its lower regions, indicating that the average losses are greater than the average gains. So, for the TSX to resume a bullish trend, breadth expansion is important and needed – more stocks need to be advancing to support a sustainable rally.