
The ascending price move towards the long-term average following a substantial market decline is a positive inflection point to assess market opportunities and risk.
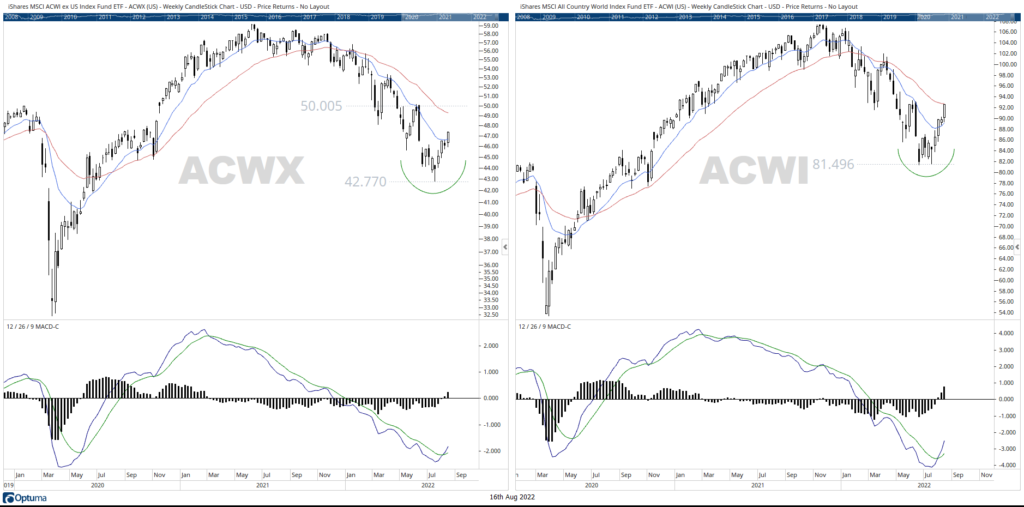
Throughout 2021/2022, the persistently strong US Dollar has been a negative catalyst for developed and emerging equity markets. The latter generally has an inverse relationship and lag developed markets on a relative strength basis. The iShares MSCI All Country World Index ETF (ACWI) is a proxy for global equities consisting of countries such as the United States, Japan, United Kingdom, Canada, China, and France, among other members. ACWI rallied 14% from July lows after finding support near Pre-COVID levels. ACWX, in contrast excludes United States exposure and provides a gauge for international equities outside the United States. ACWX fell sharply below 2020 levels before finding support at $42.77. The index rallied 11% from the lows and has recently penetrated its short-term EMA. It’s a positive to observe international equities rallying from their lows in similar fashion. Albeit the 13/34 weekly EMA has yet to turn positive for either proxies, the weekly MACD histograms highlight positive momentum supporting the recent rallies. The ascending price move towards the longer-term average following a substantial market decline is a positive inflection point to assess market opportunities and risk.
While current market developments suggest a risk-on approach, 66% of the S&P 500 constituents still trade below their 200 moving averages.
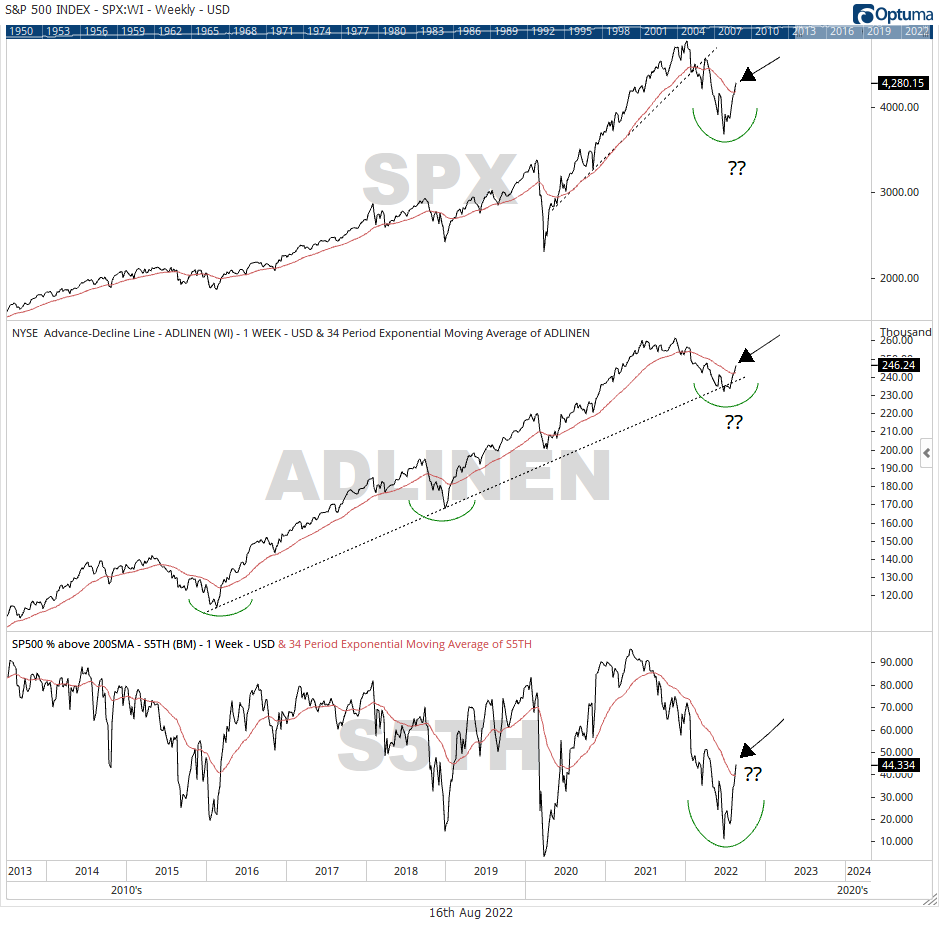
The United States account for 62% of the iShares MSCI All Country World Index (as of August 12 2022) and can significantly tilt index performance. Since summer, major US indices have rallied from their mid-June lows — the NASDAQ rose by 23%, the Dow bounced off 2020 levels by 14%, and the S&P 500 rallied by 17.50%. The prior end of the week closing above $4,200 signified accumulation of overhead supply and suggesting a risk-on attitude. Since falling 24.5% from highs to summer lows, the S&P 500 is making ‘higher highs’ on the backdrop of momentum and market breadth expansion. The summer lows provide an intermediate-term marker and left unbroken may establish a sideways market or develop into a market uptrend — formation of higher highs and higher lows. If the summer lows are breached, further weakness is being priced in. Of the three, the latter scenario is clearly less desired.
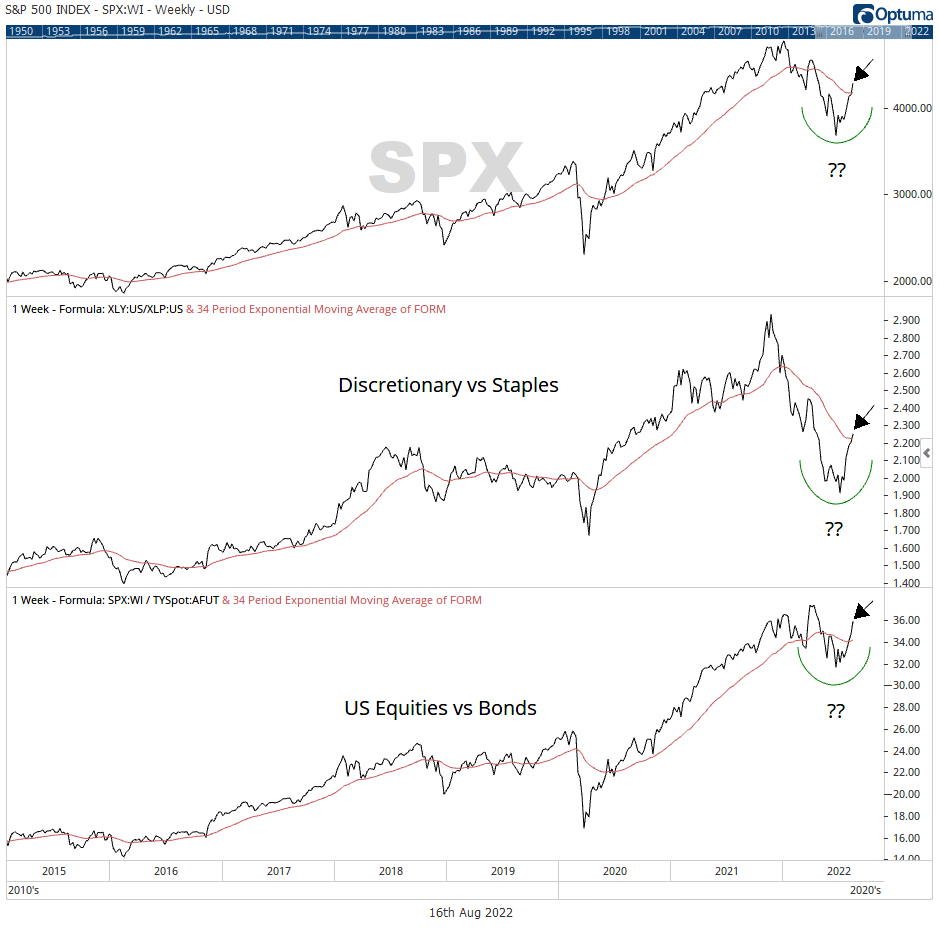
Supporting the risk-on narrative, US equities are showing relative strength to 10 Year Treasuries and Consumer Discretionary are gaining grounds relative to Consumer Staples. Are market participants shifting from defense to offense going into the third quarter of 2022? Improving breadth expansion on beta rotation may be suggesting so. The cumulative breadth measure of net advances, shown by the NYSE Advance/Decline Line, is coming off a well-established ascending trend line and is perhaps re-establishing position above its 34 weekly EMA. The rising line is a positive development — more securities are advancing than declining. Increasing degrees of market participation would chalk support for a potential transition from a market bottom, if that’s indeed what’s happening. While these events point to optimism, 66% of the S&P 500 constituents remain below their respective 200 SMAs. It’s discernable that market internals are progressing in the right direction from June breadth lows, however, breadth measure greater than the 50% threshold would add a splash of conservatism to early bullish confidence.
The early signs of improvements in price action, momentum, market breadth, and relative strength in equities (to bonds) and cyclical sectors (to defensive sectors) provide progress towards a potential market transition.
Canada exposure accounts for a lesser weighting of the world index, 3.11% of the iShares MCSI ACWI, as of August 12 2022. The S&P TSX Composite Index to date is at -4.91% versus the growth-oriented S&P 500, which is at -10.19%. TSX relative strength to US equities was attributed to rising oil prices and strength in the Energy sector during the first half of the year — greatly benefiting the resource-heavy TSX composition. Currently, the S&P/TSX Capped Energy Index maintains market leadership, despite loosing 33% of value during Q2, the group is up 40.2% to date. Also leading the way are Consumer Staples and Utilities — adding defensive buffers during the summer volatility, delivering 6.3% and 5.4% to date, respectively. As the market rally picks up steam, it’s worth noting that the S&P/TSX Capped Industrials Index has noticeably crept back to positive territories (2.2% to date) and shows the strongest momentum when compared to sector peers. More importantly, the sector continues to maintain relative strength to the the broader market (Weekly Relative Strength).
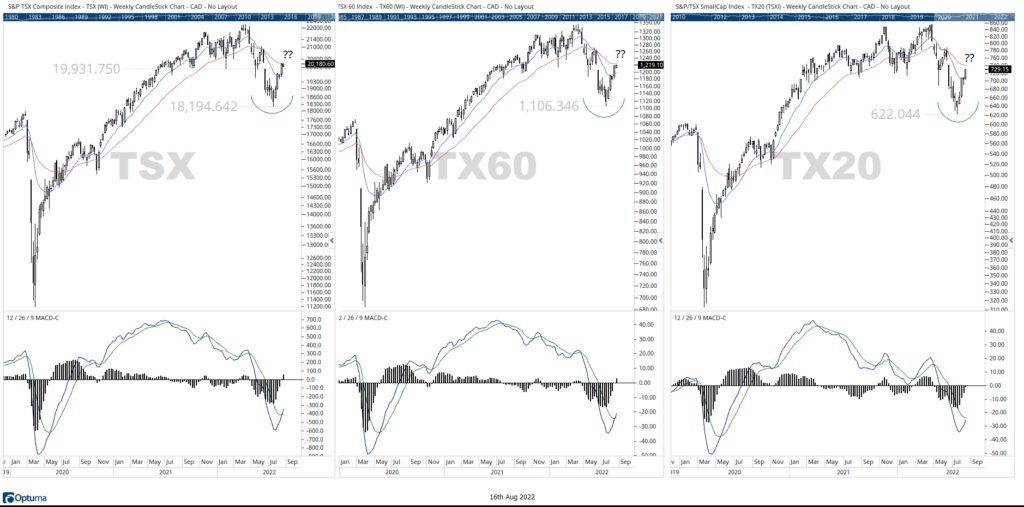
The S&P TSX Composite Index bounced from peak-summer lows as did the bluechip index and the small-cap index — all carving out notable areas of support from mid-July. The leading index tested Pre-COVID levels of $18,000 but quickly rallied by 12% on renewed market enthusiasm, closing above $19,930 — an established level of support (turned resistance) during the distribution phase of the market. The weekly MACDs exhibit positive momentum as the indices approach their respective 34 weekly EMAs.
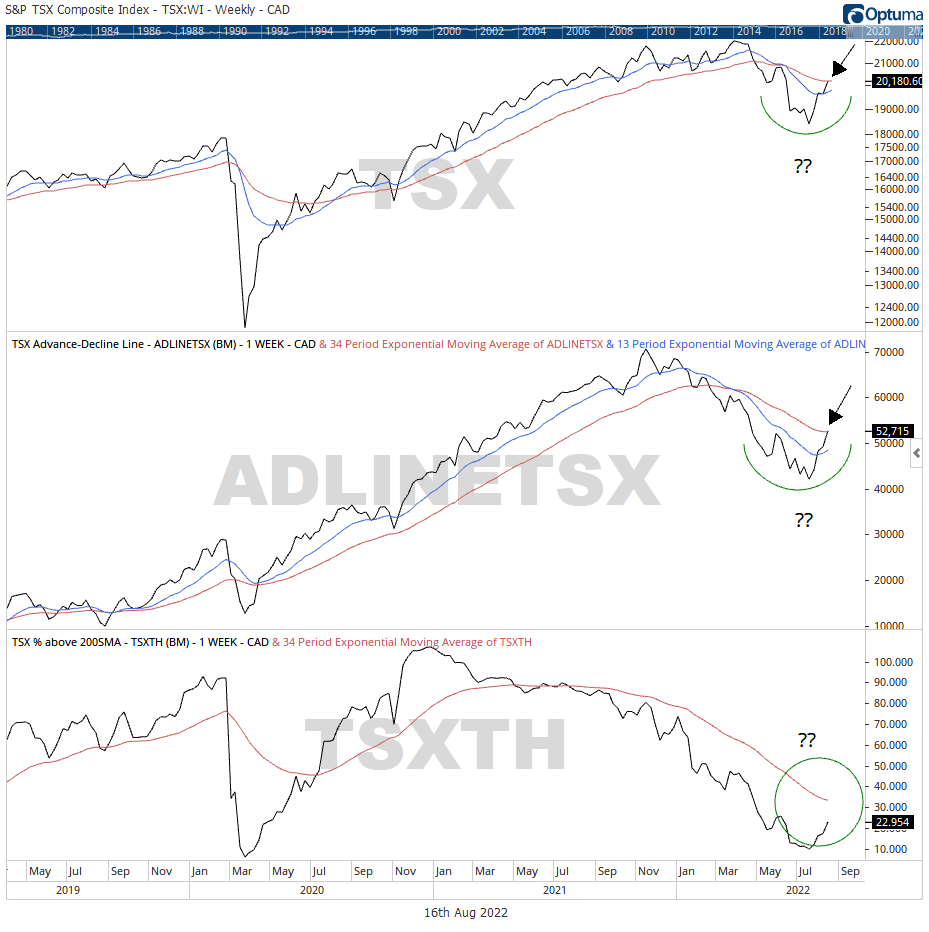
Generally, market breadth deteriorates at market tops and expands at market bottoms. Breadth in the S&P TSX Composite Index is improving and supportive of the recent rally, resembling US market themes. The TSX Advance/Decline Line is rising on positive net-advances towards its longer-term smoothing average. While, the AD Line is expanding from July lows, the percentage of index constituents trading above their 200 SMAs remain negative — well below the 50% threshold. As it stands, more than 75% of index constituents are below the long-term filter, indicating that breadth expansion maintains a bearish bias and requires further development.
The early signs of improvements in price action, momentum, market breadth, and relative strength in equities (to bonds) and cyclical sectors (to defensive sectors) provide progress towards a potential market transition. A conservative approach would be to monitor a positive 13/34 EMA signal with strong momentum and breadth expansion above the 50% threshold as the market shapes into ‘higher highs/higher lows’, should a new uptrend materialize from the somber summer lows.