
The CRB Index, on US Dollar relative strength and softening economic growth, has reverted back and crossed below its 50 day mean.
The Thomson Reuters/Jefferies CRB Commodity Index, despite relative strength in the US Dollar, rate hikes, and recession fears, is up 31% year to date, vastly outperforming both bonds and equities. The S&P 500 is down 21.10%, largely depressed from the thematic backdrop of persistent inflation and over-weighted exposure to growth-oriented industries. The iShares Core US Aggregate Bond ETF (AGG), a proxy for the total US investment grade bond market is down nearly 11% due to contractionary central bank policies aimed at taming inflation, resulting in rising rates which inversely led to declining bond prices.
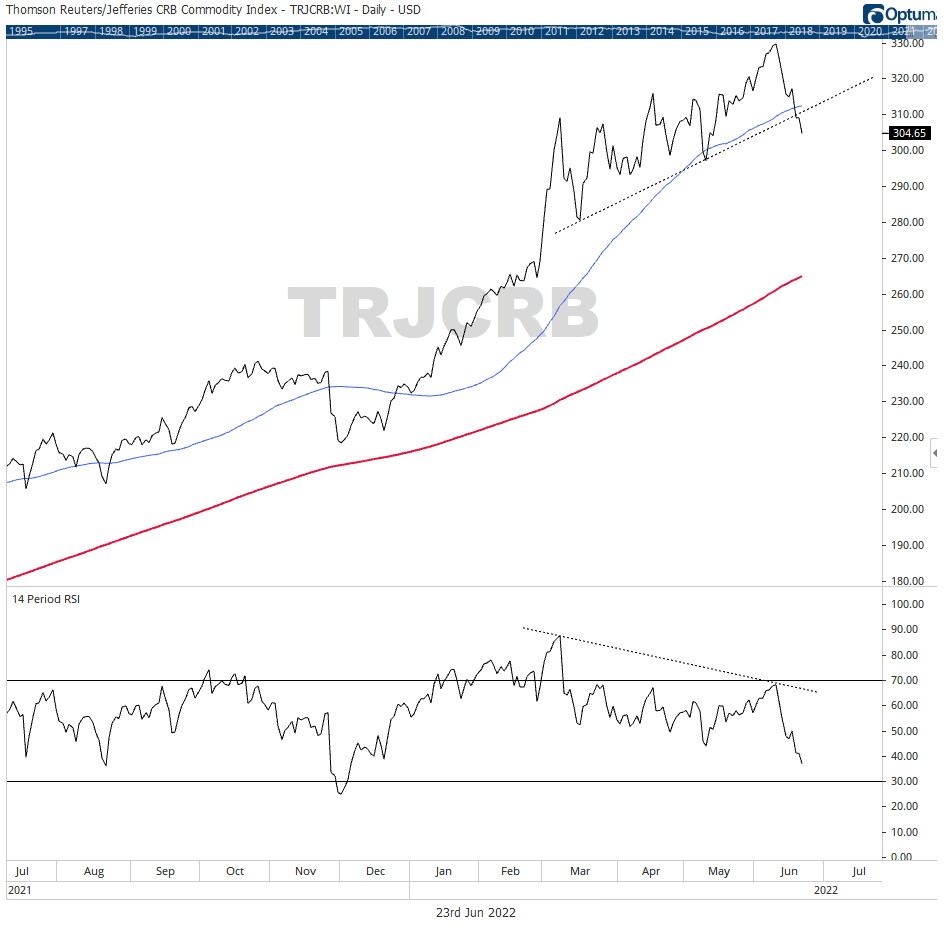
The equities market, serving as leading economic indicator is pricing in an increasing probability of an economic recession. At the later stages of economic expansion, commodities continue to exhibit relative strength to bonds and equities. Bonds tend to turn-over before equities and equities tend to turn-over before commodities. The 10 Year US Treasuries broke below its 200 day moving average in the fall of 2020 and the S&P500 followed suit in the first quarter of 2022. The CRB Index, on US Dollar relative strength and softening economic growth, has reverted back and crossed below its 50 day mean. And, RSI is showing a bearish divergence in a bullish regime for commodities, raising caution in the near term of a possible chronological script — could commodities eventually follow?
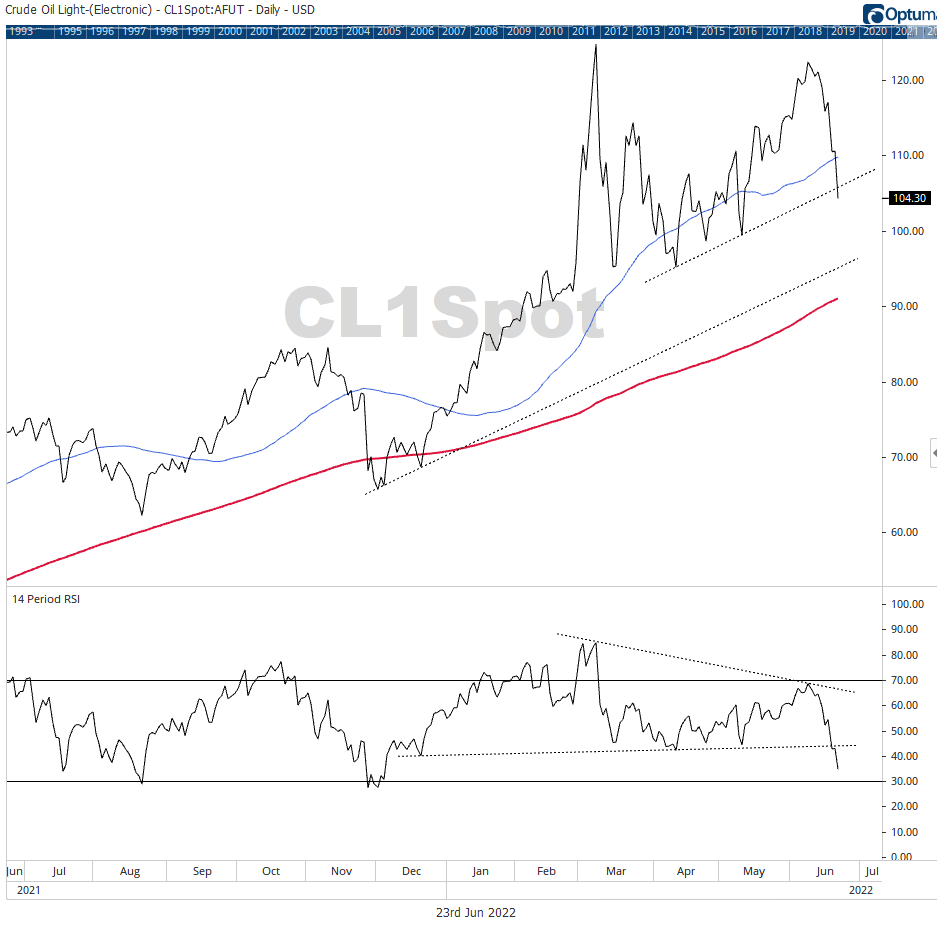
Since mid-June, crude has fallen by 18% on fears of further rate hikes that could push the US economy into a recession.
Crude oil, a staple constituent of the Commodities Index, is up by nearly 40% year to date, resembling a similar trajectory and price structure to the CRB Index. Since mid-June, crude has fallen by 18% on fears of further rate hikes that could push the US economy into a recession, thereby, softening demand for crude. The price of crude oil crossed below its 50 day moving average and breaks below an established short-term trendline, highlighting downward pressure at the absence of short-term demand. The US Federal Reserve has continued to communicate commitment to bringing down inflation and in doing so, increases in the central bank rate policies are highly considered.
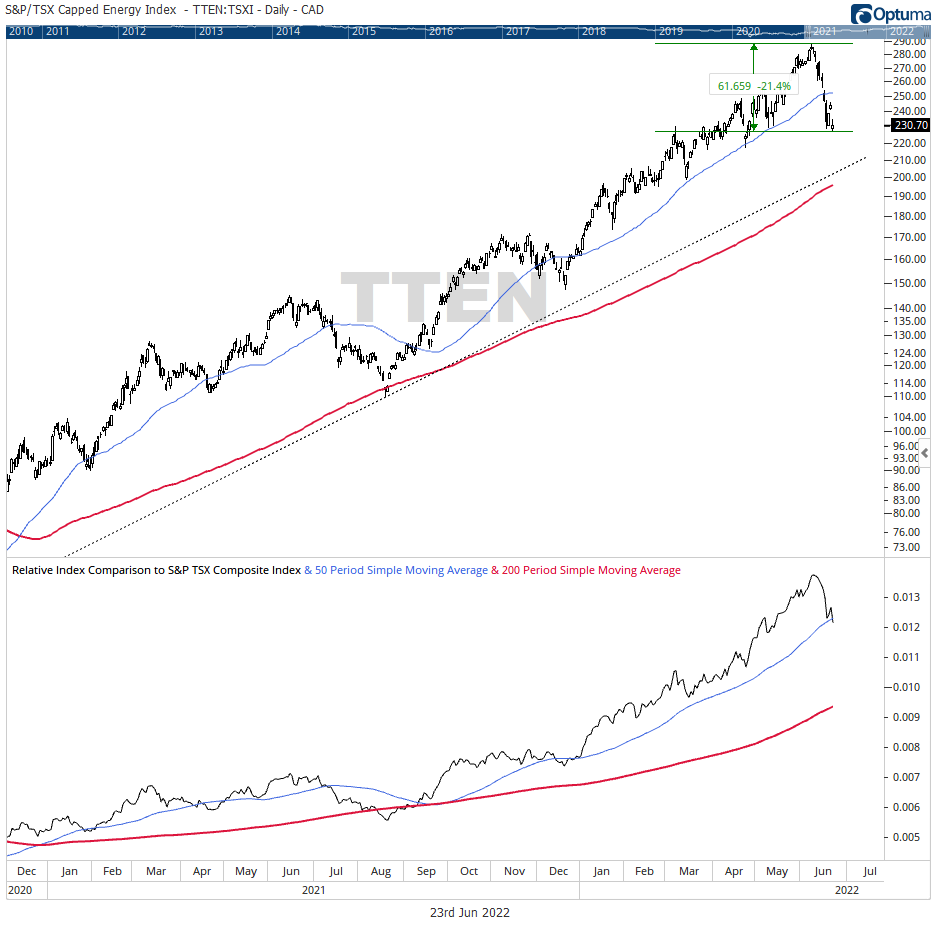
Its noteworthy that defensive sectors such as Consumer Staples and Utilities are also showcasing relative strength to the broader market, supporting a risk-off market attitude as investment capital seeks low beta alternatives.
The S&P/TSX Capped Energy Index remains the only sector above choppy waters. To date, the sector is up nearly 41%. Having peaked in early June, closing at $285, the group has since fallen by 22% on crude oil weakness. The sector following recent sell-off now accounts for less than 20% of the S&P/TSX Composite Index. Price has broken below an intermediate moving average and sustained downward pressure may bring the sector to retest its 200 day moving average. Sector relative strength is waning as the relative strength ratio moves below its 50 SMA as the group tests 2016 support levels of $230. Failing to find support at $230 would suggest further weakness. Its noteworthy that defensive sectors such as Consumer Staples and Utilities are exhibiting relative strength to the broader market, supporting a risk-off market attitude as investment capital seeks low beta alternatives (Weekly Relative Strength). Also interesting is that nearly 60% of group constituents are priced below their respective 34 weekly exponential moving averages, a metric used to gauge long-term price trend.
Sustained weakness in commodities and crude continue to filter through the S&P/TSX Composite Index, particularly in Energy and Basic Materials.
The S&P/TSX Composite Index has held up well during the market sell off. To date, Canada’s headlining barometer is down 10.45% compared to -21% for the S&P 500. The relative strength in commodities for much of 2022, specifically in energy, has benefited Canada’s resource heavy index. But, weakness in crude oil and the energy sector has contributed to distribution/decline in the index in recent weeks. Mid-June, the weekly 13/34 EMA model turned negative following a brief rally that proved to be unstainable as the price action lacked broader market participation.
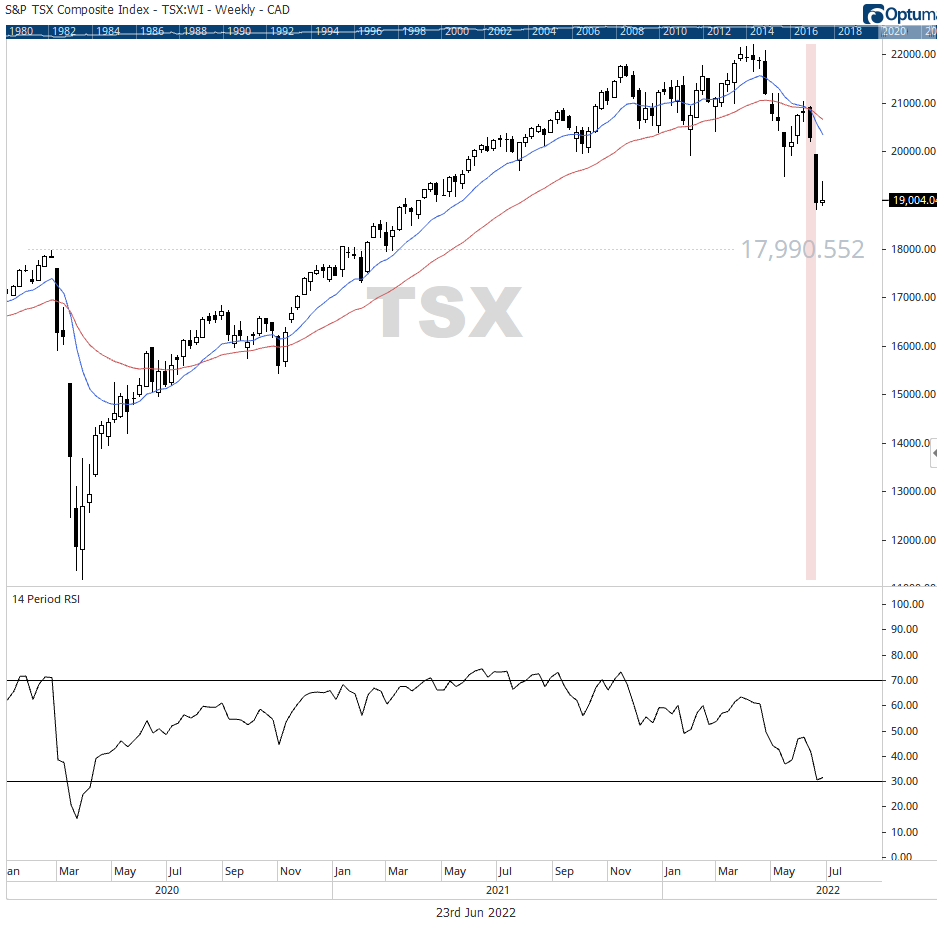
Weakness in commodities and crude are filtered through the TSX, particularly in Energy and Basic Materials. For the first time since March of 2020, the weekly RSI has tested oversold levels, signaling a possible regime change for the index. For now, the index has yet to be ushered in to the bear market club, where arbitrary inclusion is satisfied with a 20% decline in price. The index did peak in April of 2022 while TSX Advance/Decline Line topped in November of 2021. The AD Line provided a precursor of weakness in market breadth which turned negative in March of 2022, confirming suspected weakness in market participation. As it stands, roughly 85% of the index constituents trade below their 200 day SMA, and roughly 90% are priced below their 50 day SMA, evident that weakness in the index is widespread. The S&P/TSX Composite Index is not too far off from 2020 Pre-Covid highs of $17,970. This price area will provide a key support zone to monitor in the coming days and weeks on continued global market turbulence.